Upper Air Observations ("Super Pete")
Upper Air data used to create these maps are provided by NOAA/NWS and NSF Unidata
NOTE - NCEP is planning to discontinue the NAM model as of October 14, 2026 to be replaced with the RRFS model. At that time, the NAM analysis maps will likely be replaced with the RRFS analyis
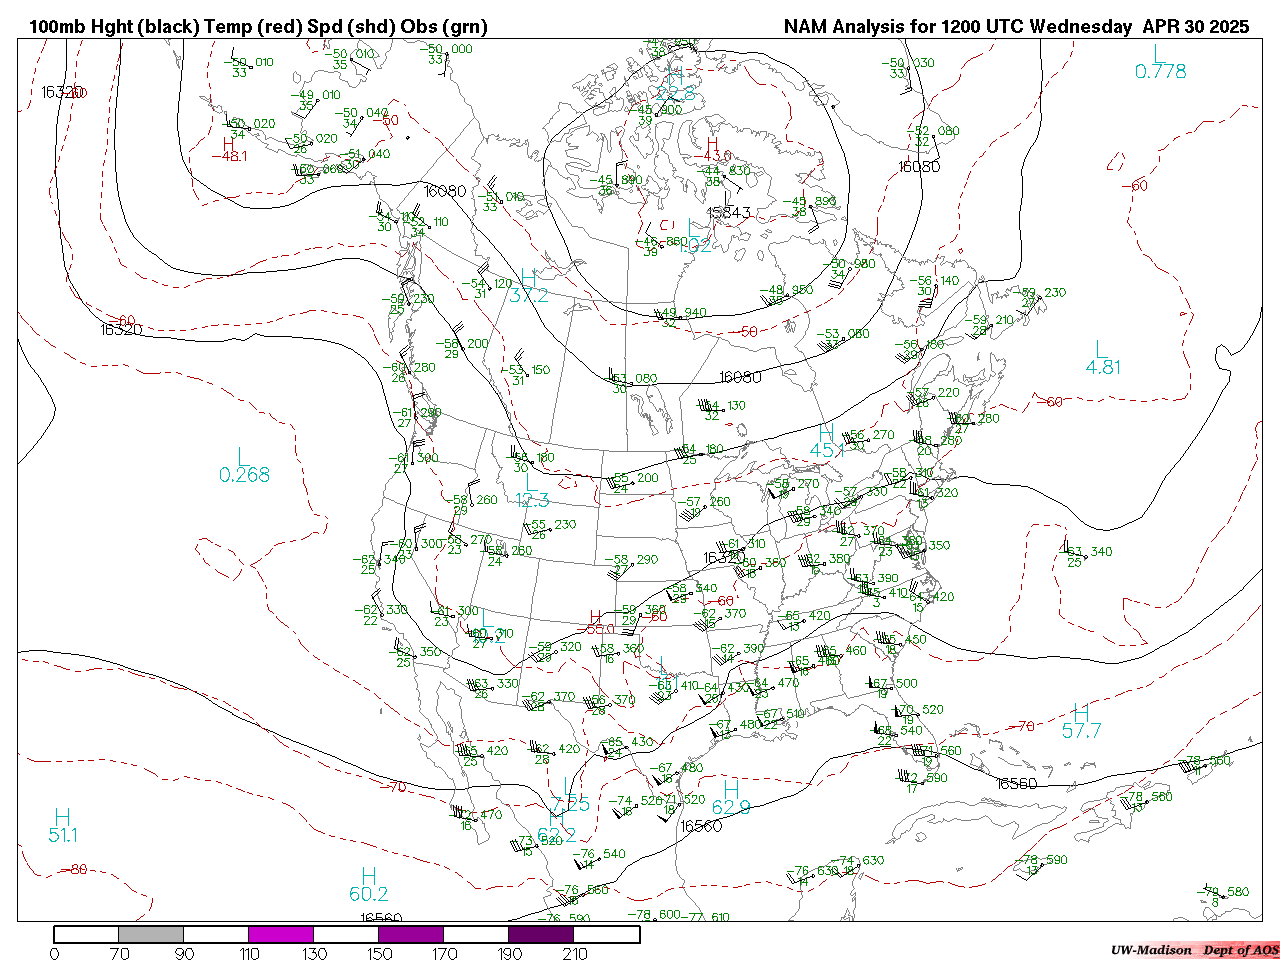
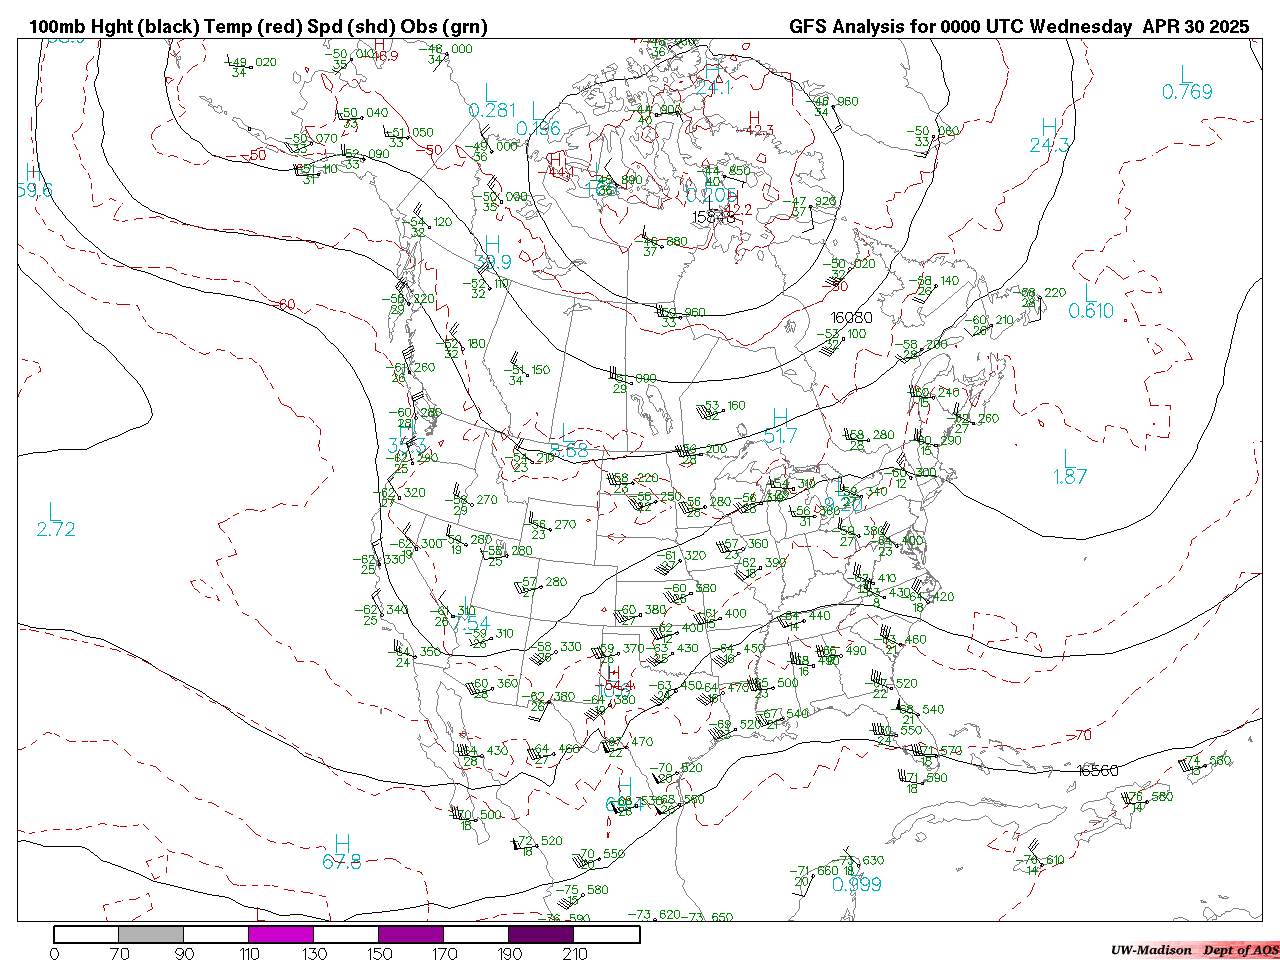
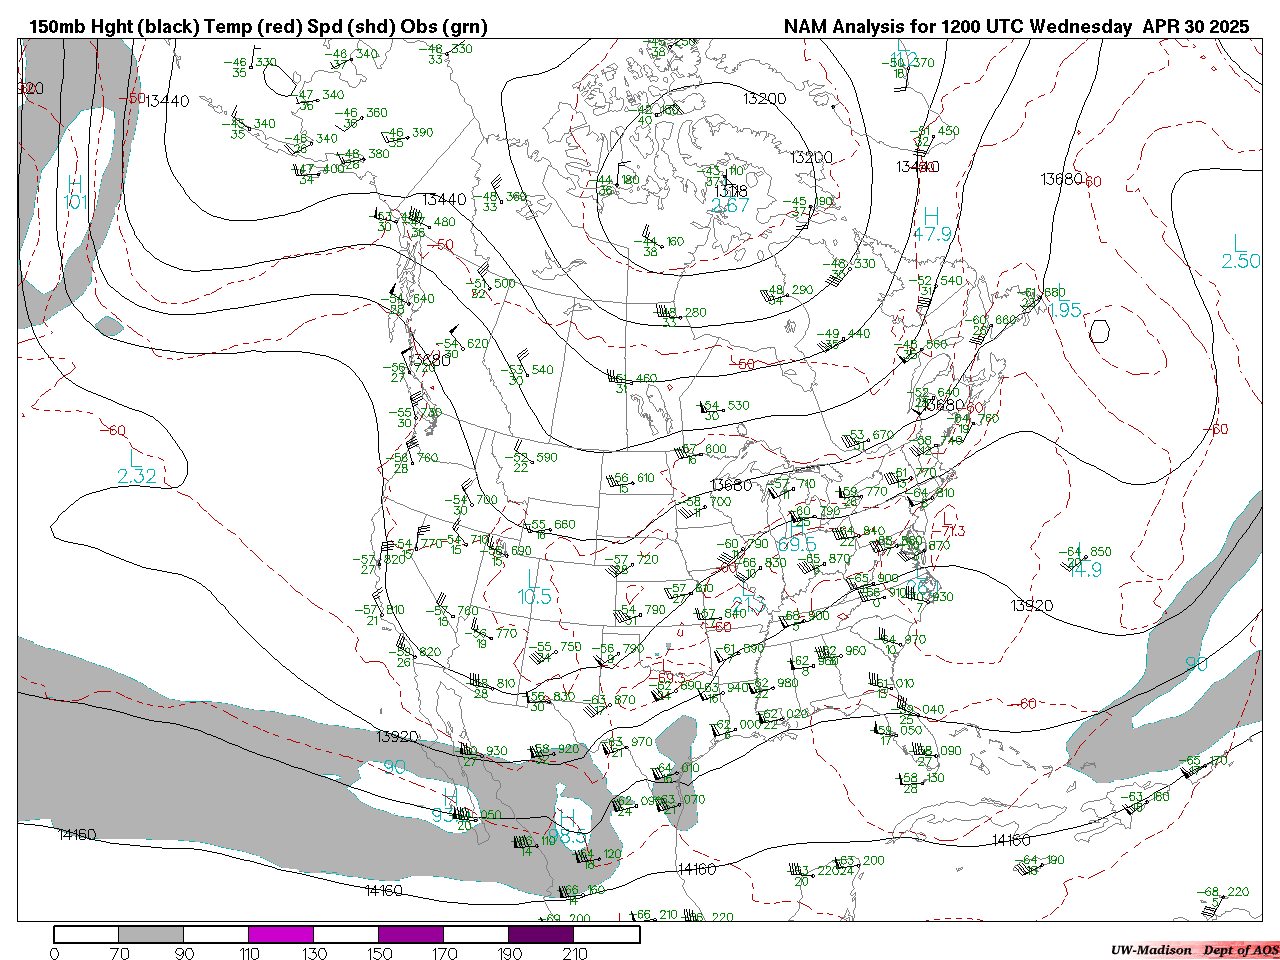
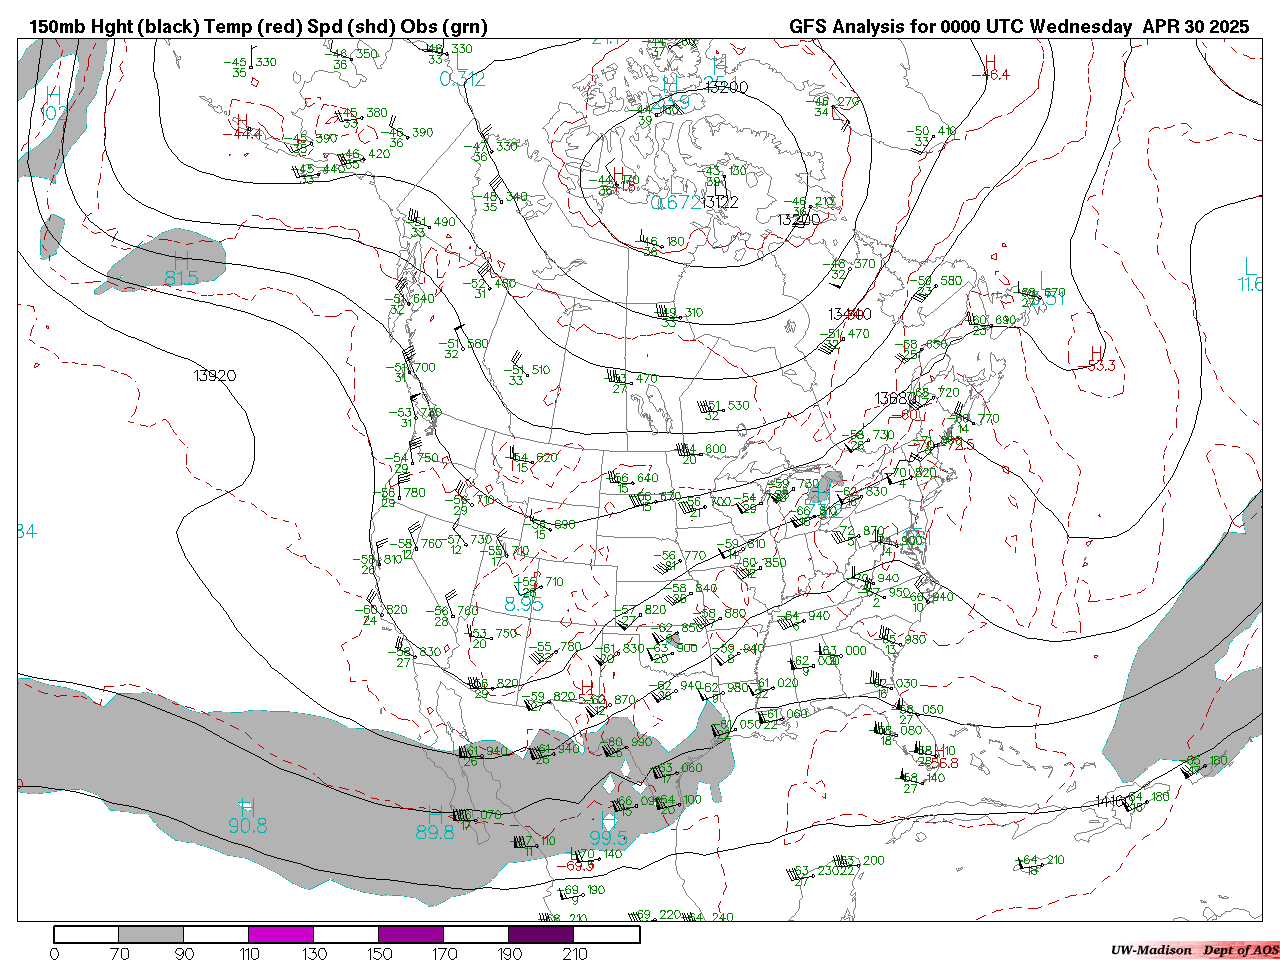
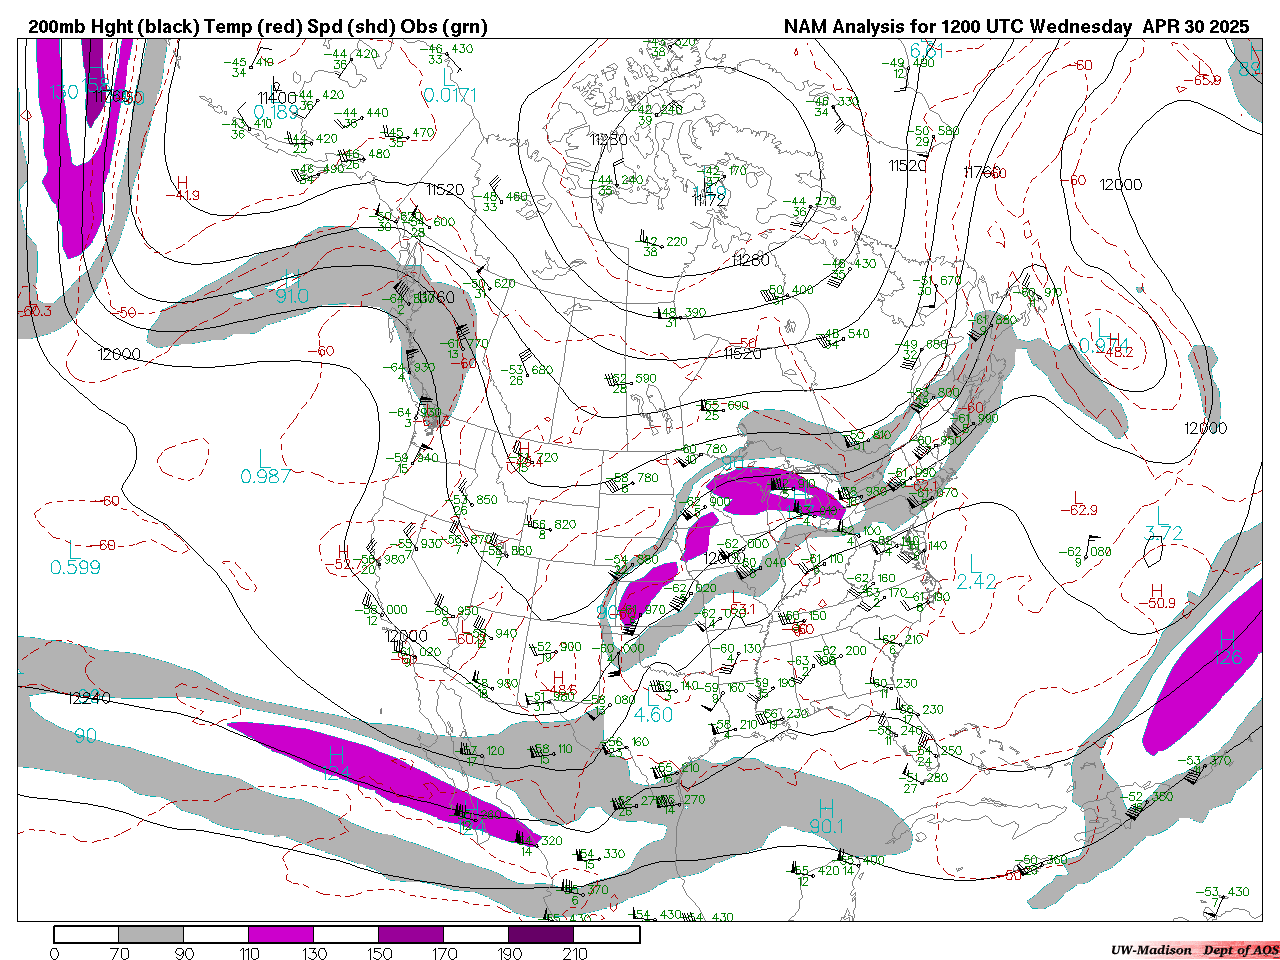
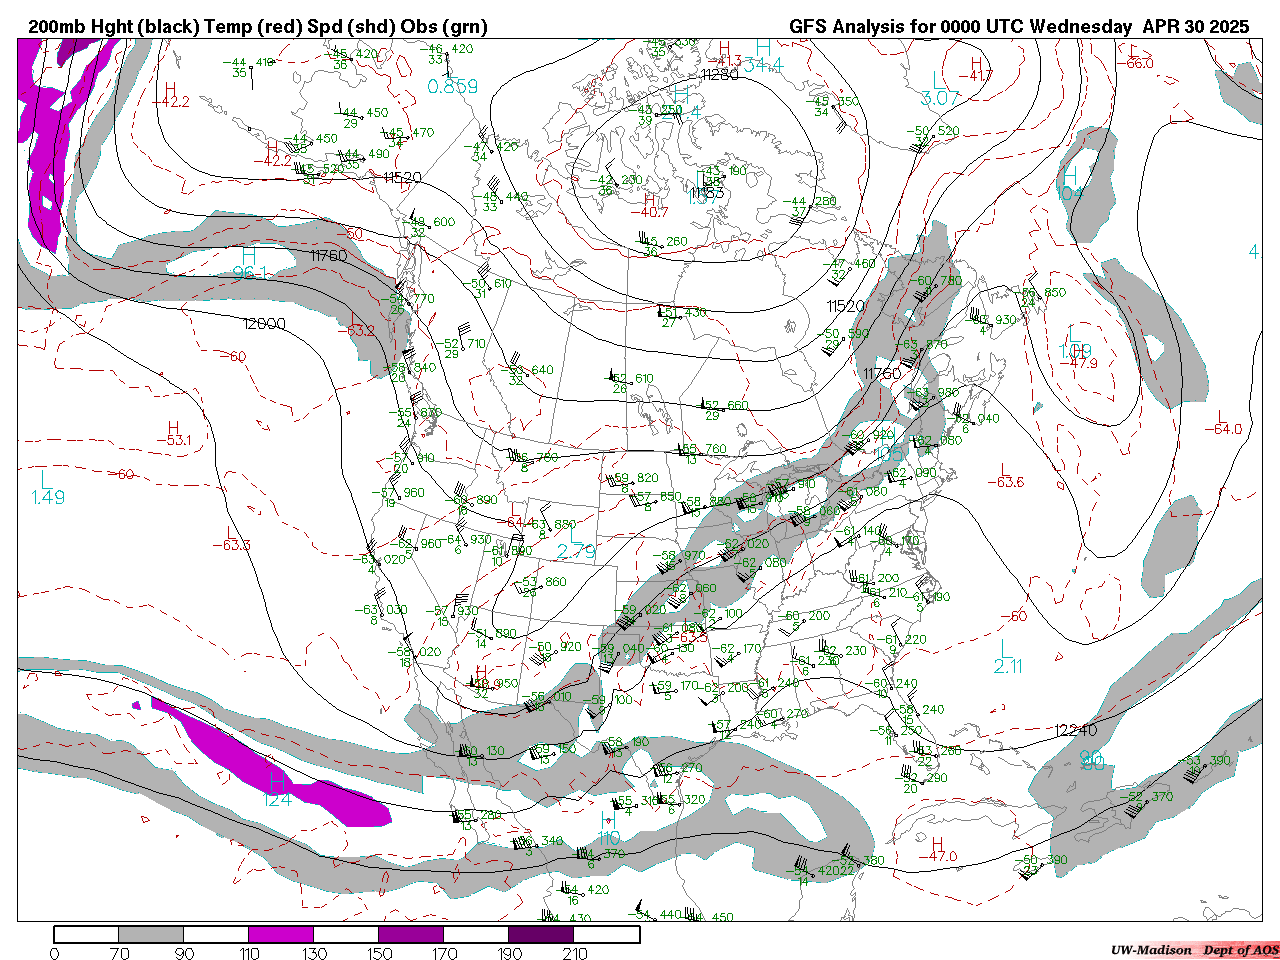
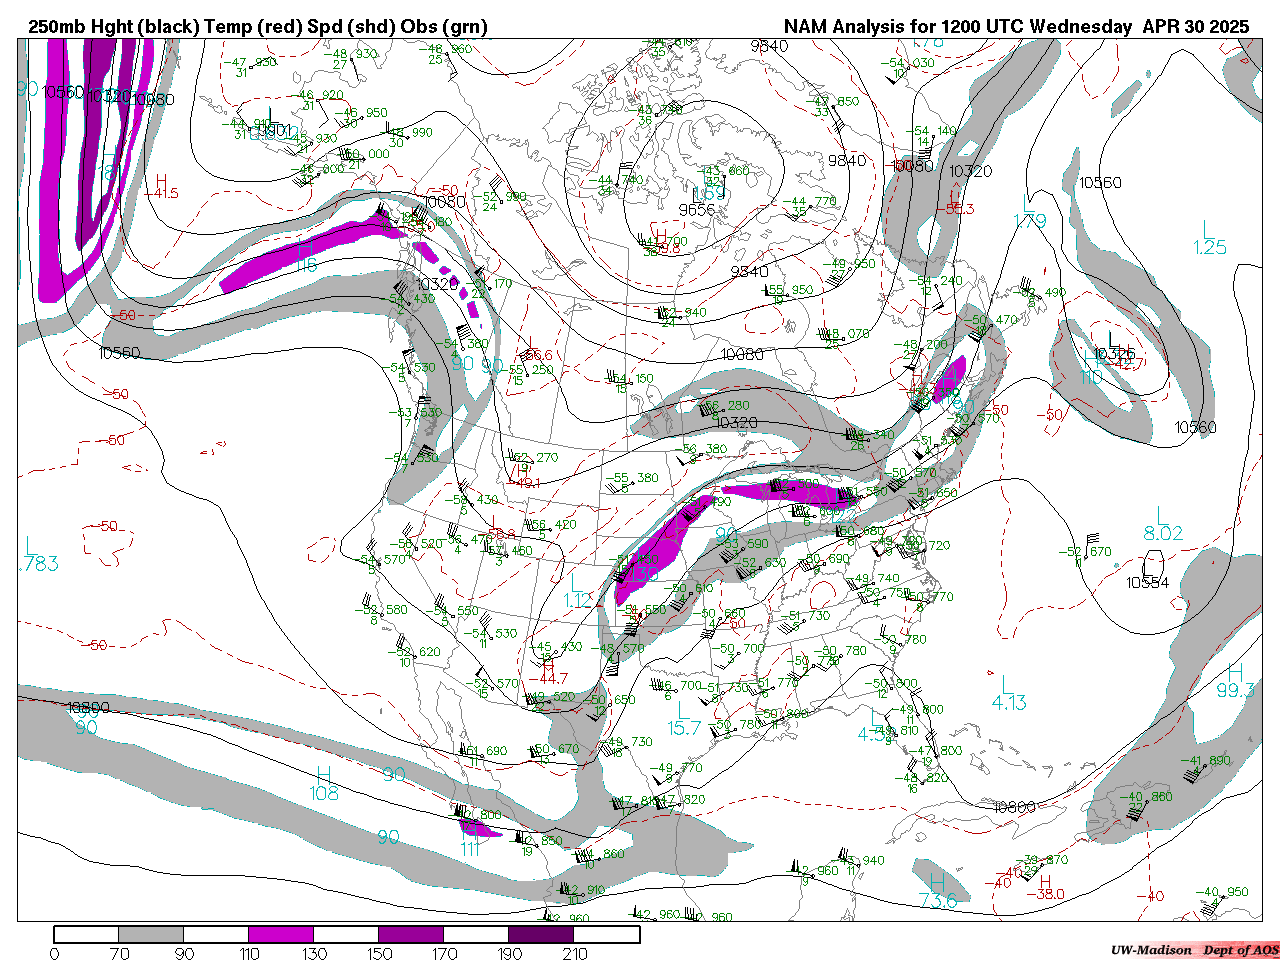
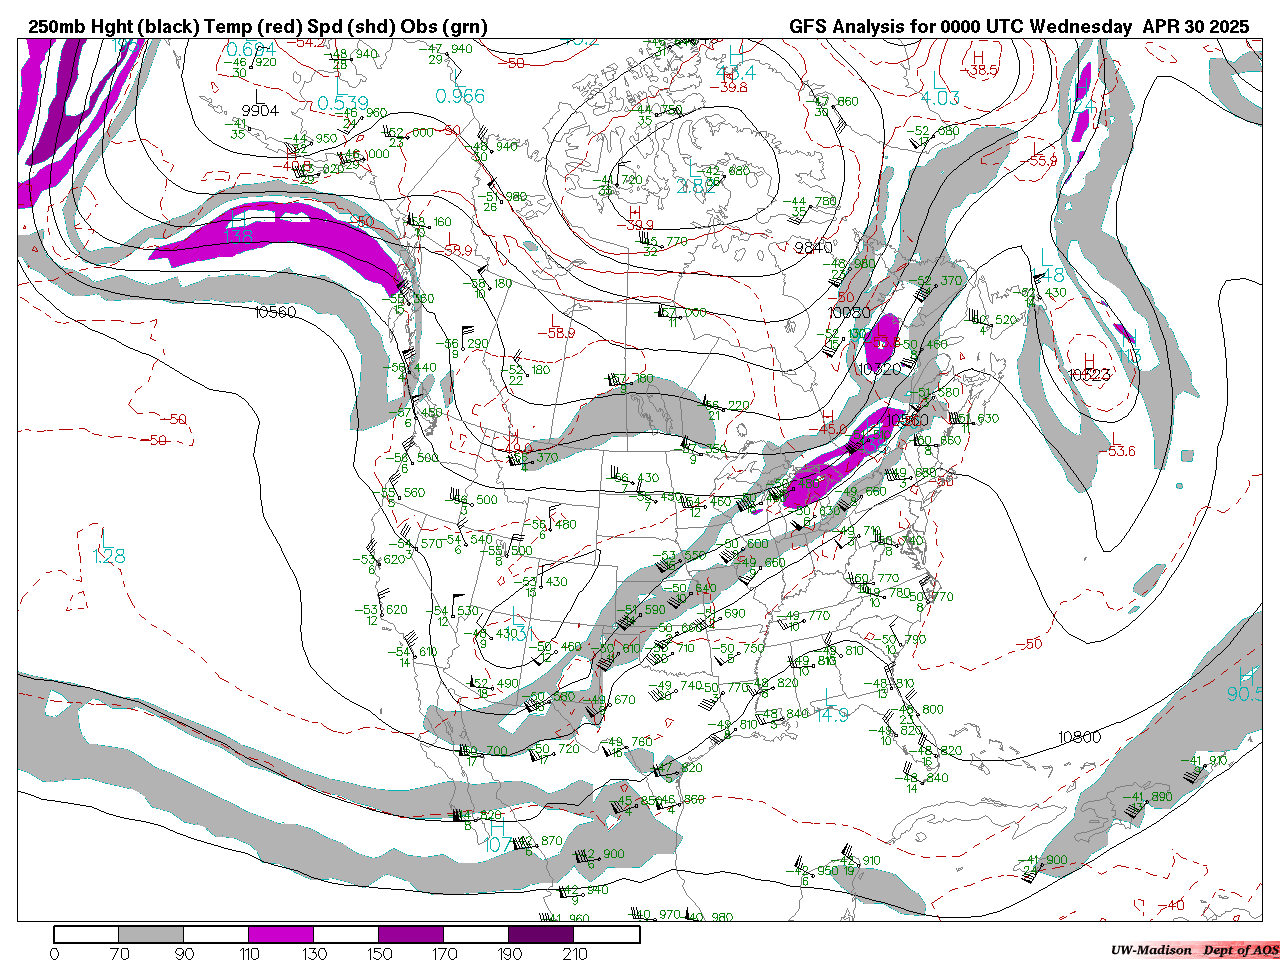
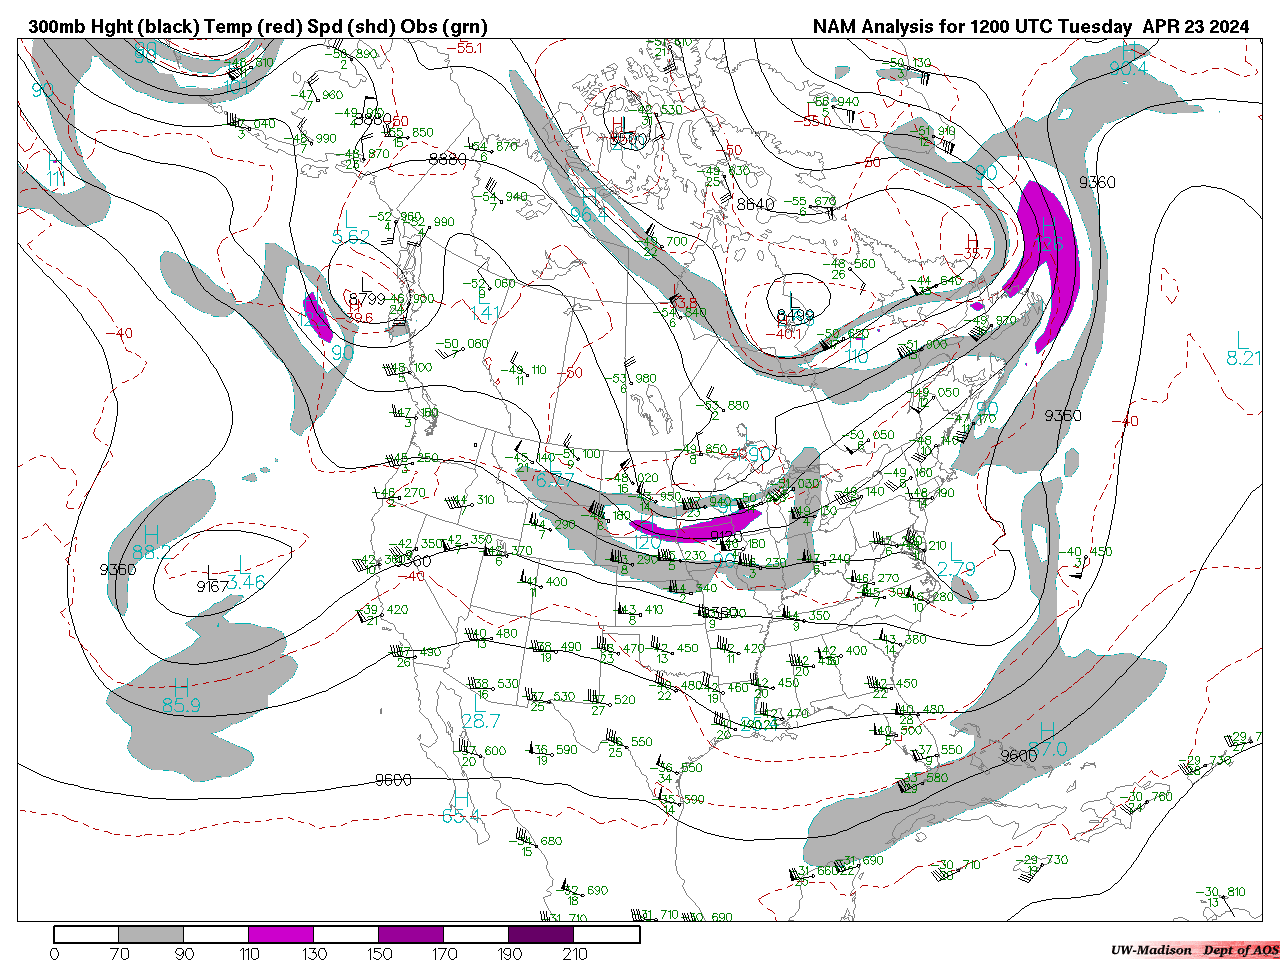
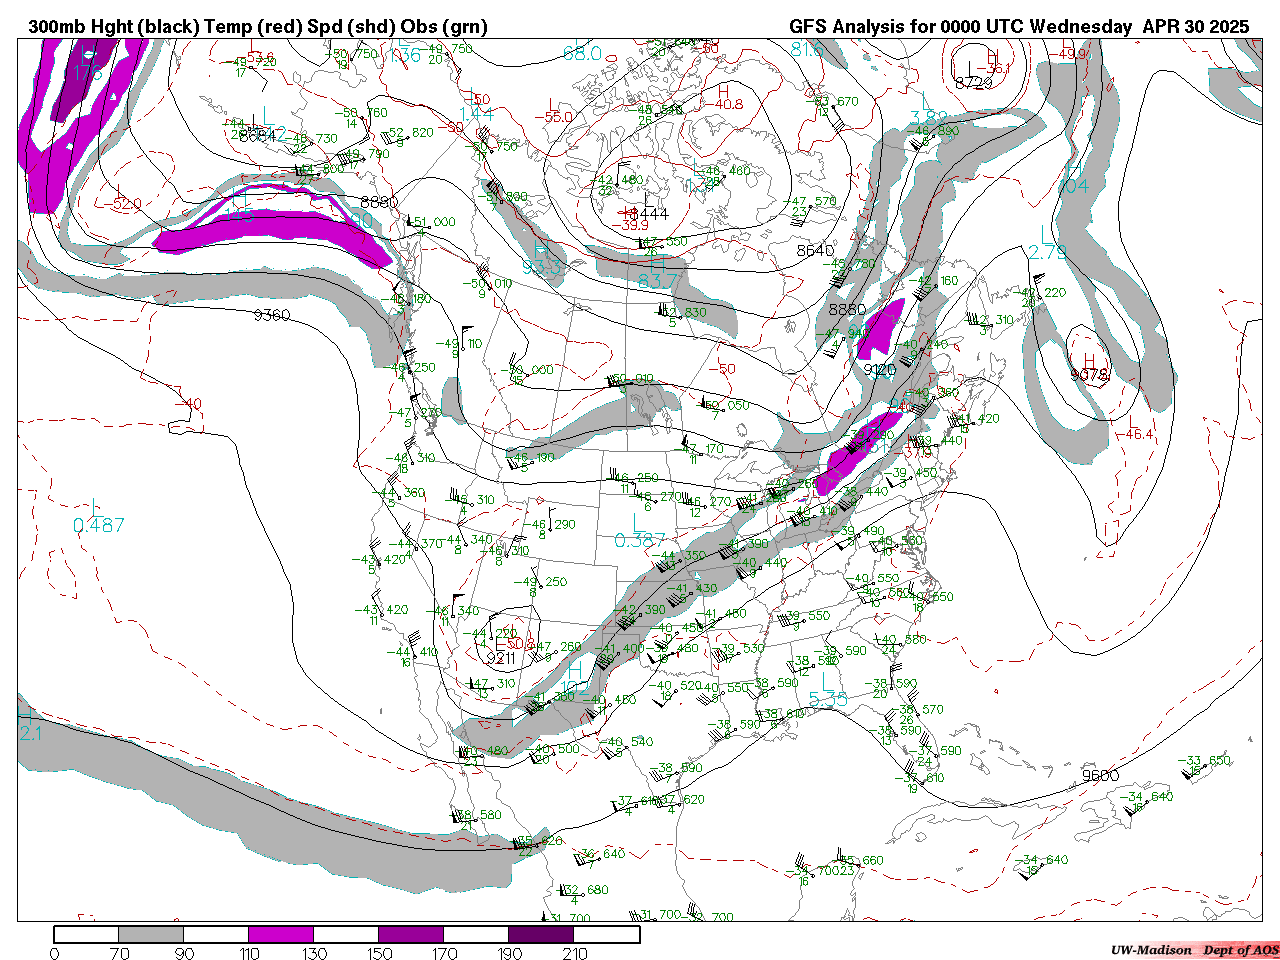
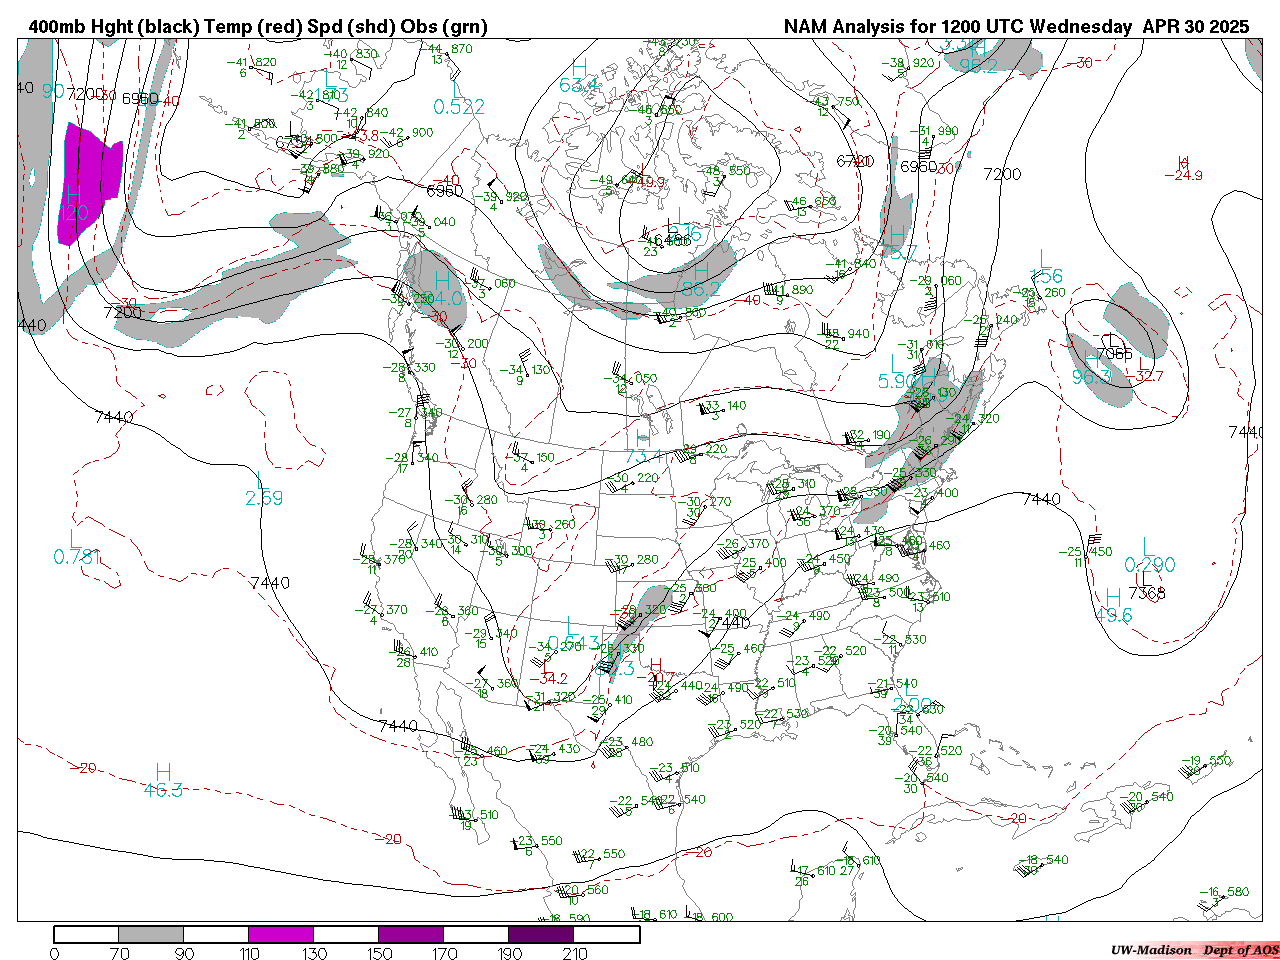
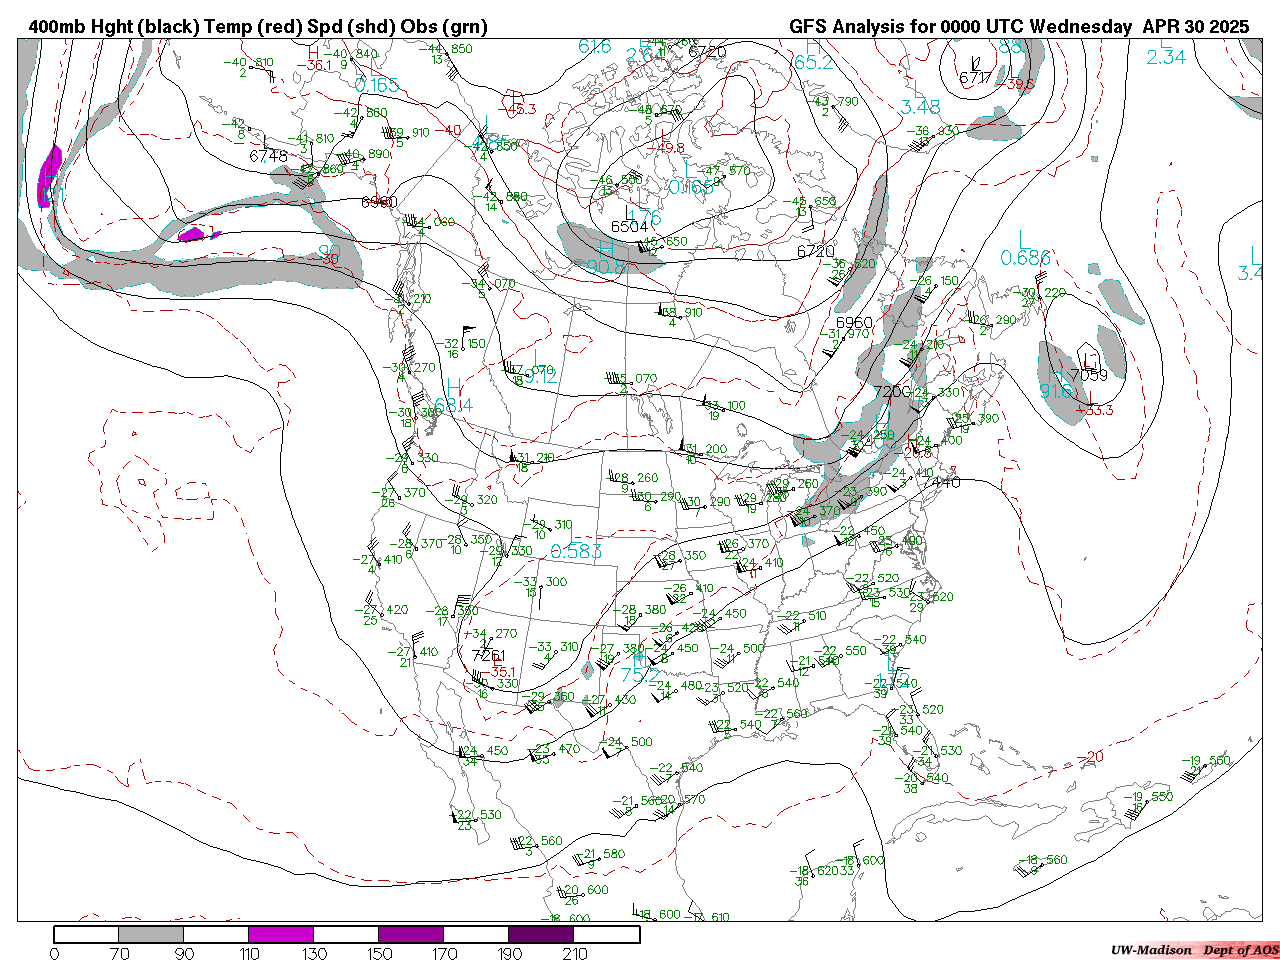
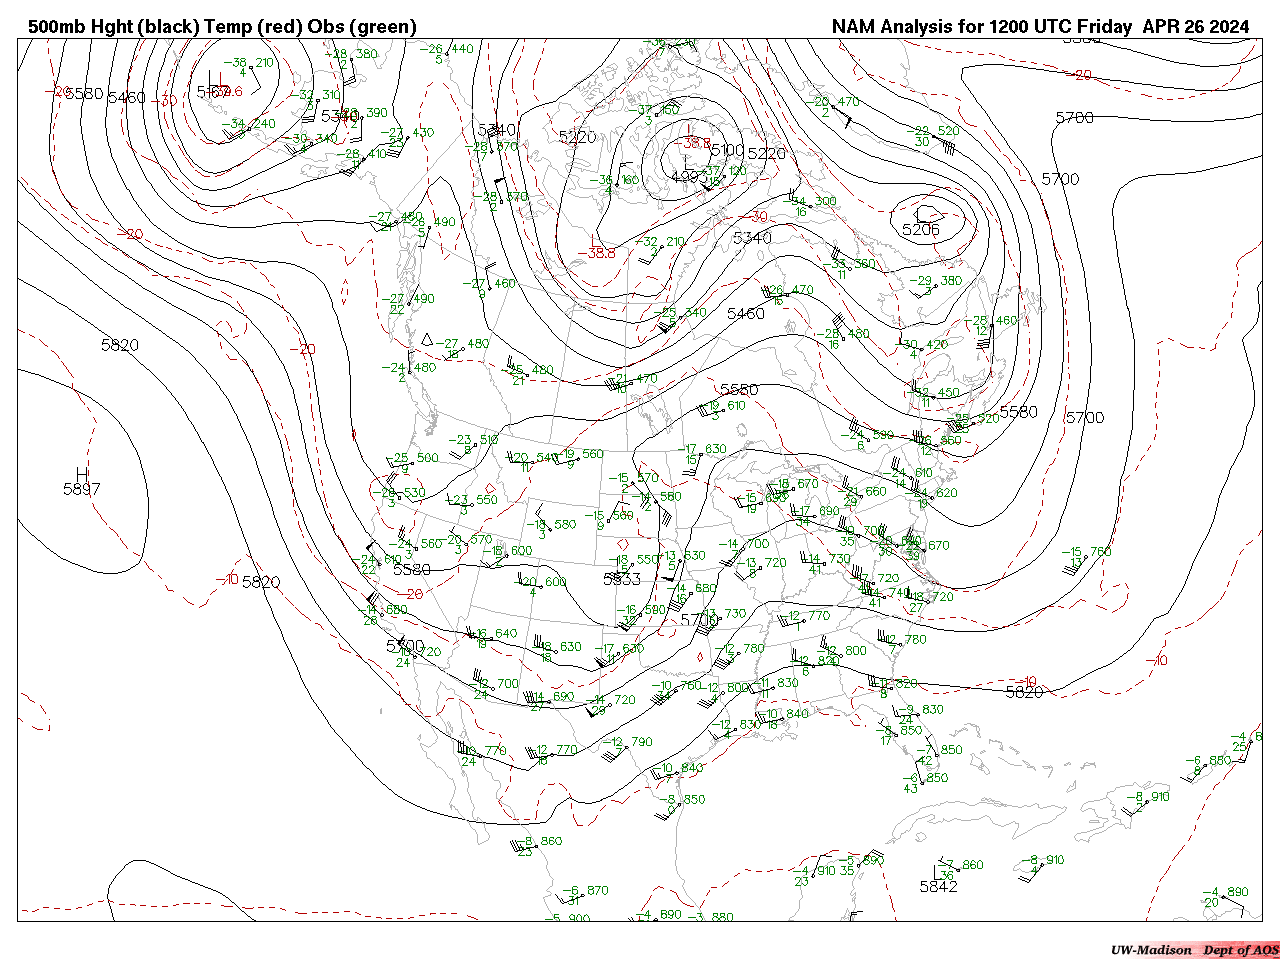
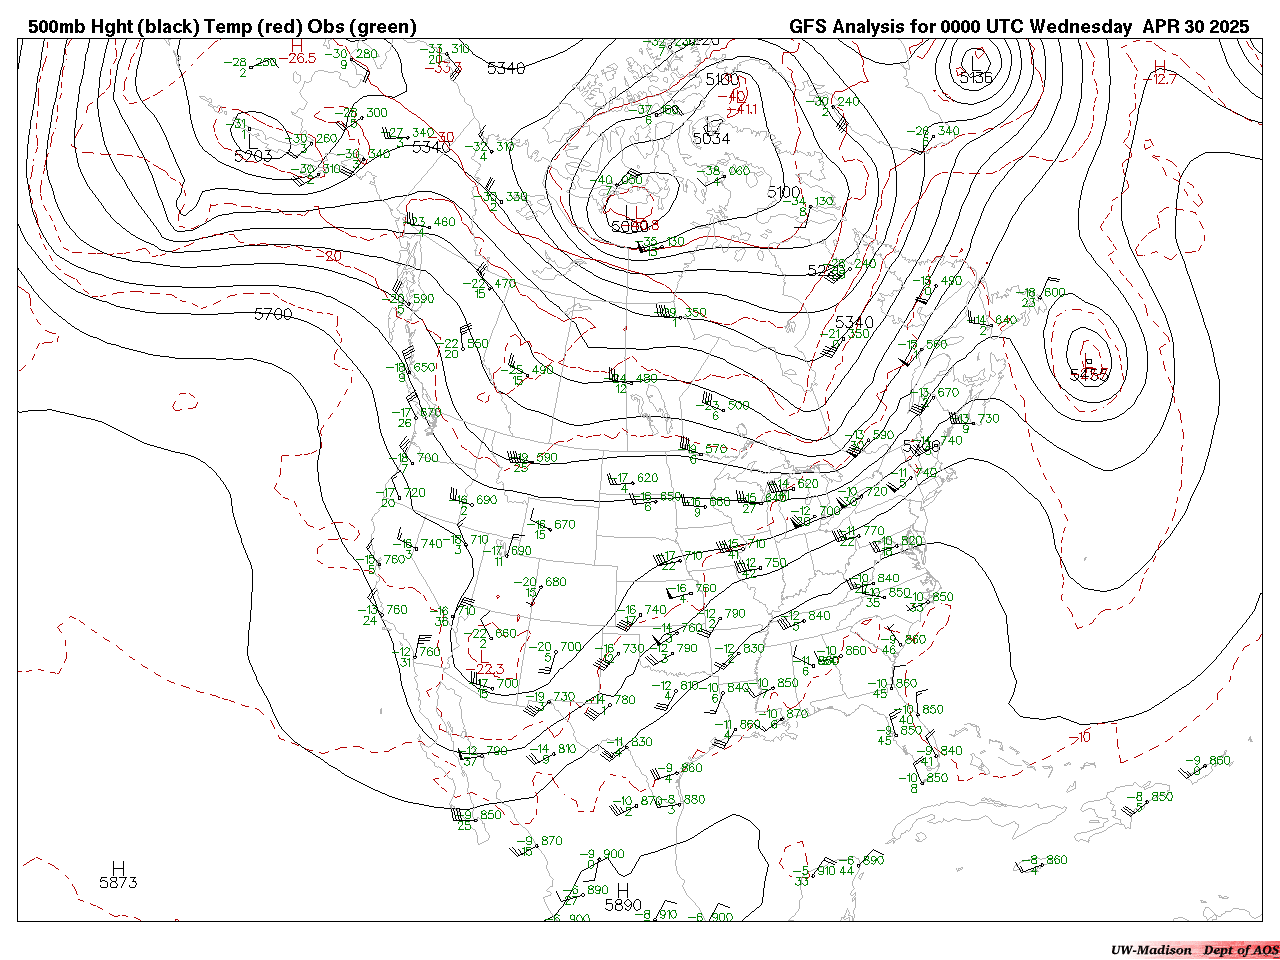
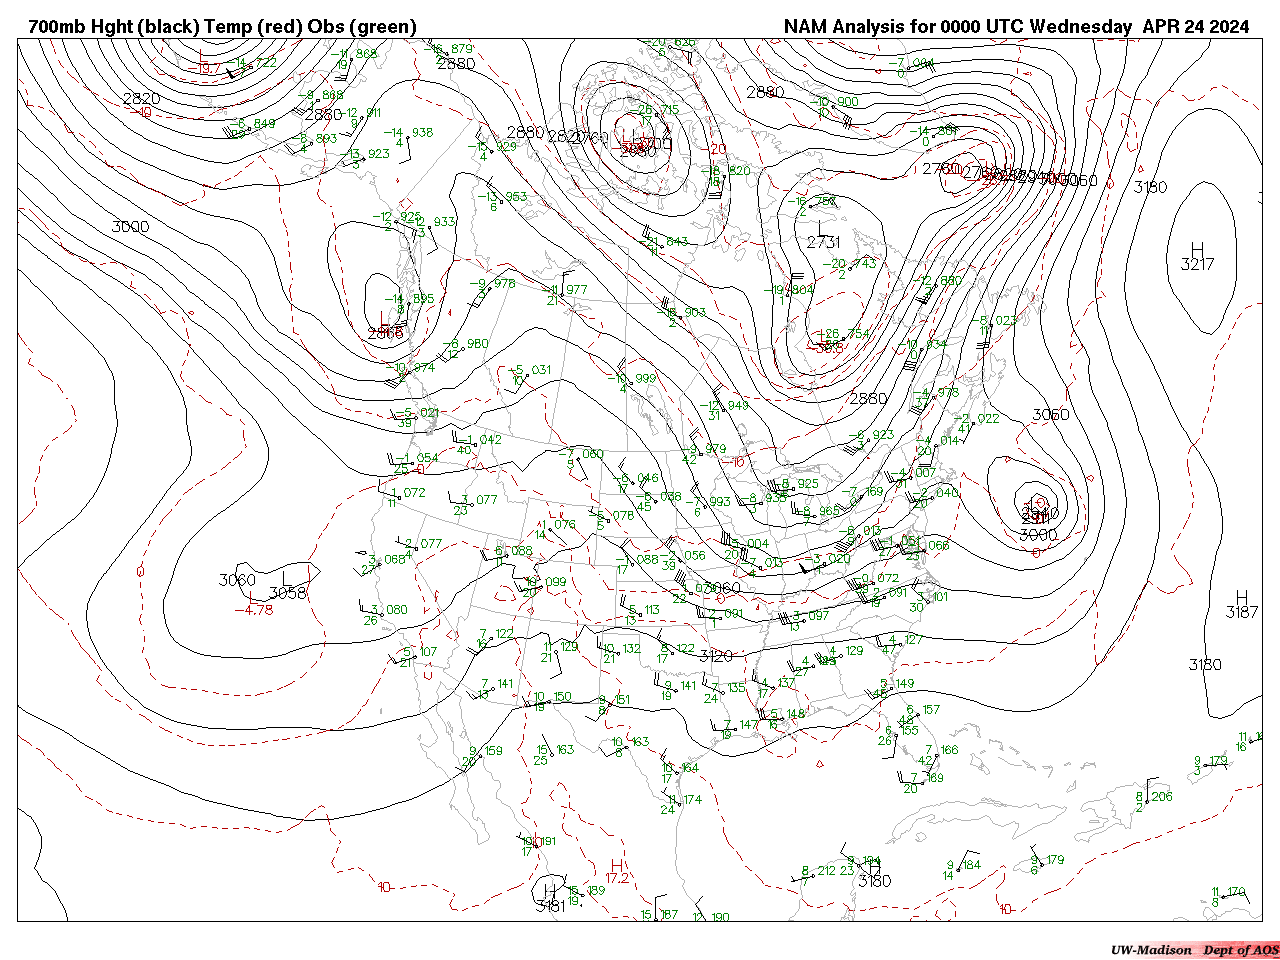
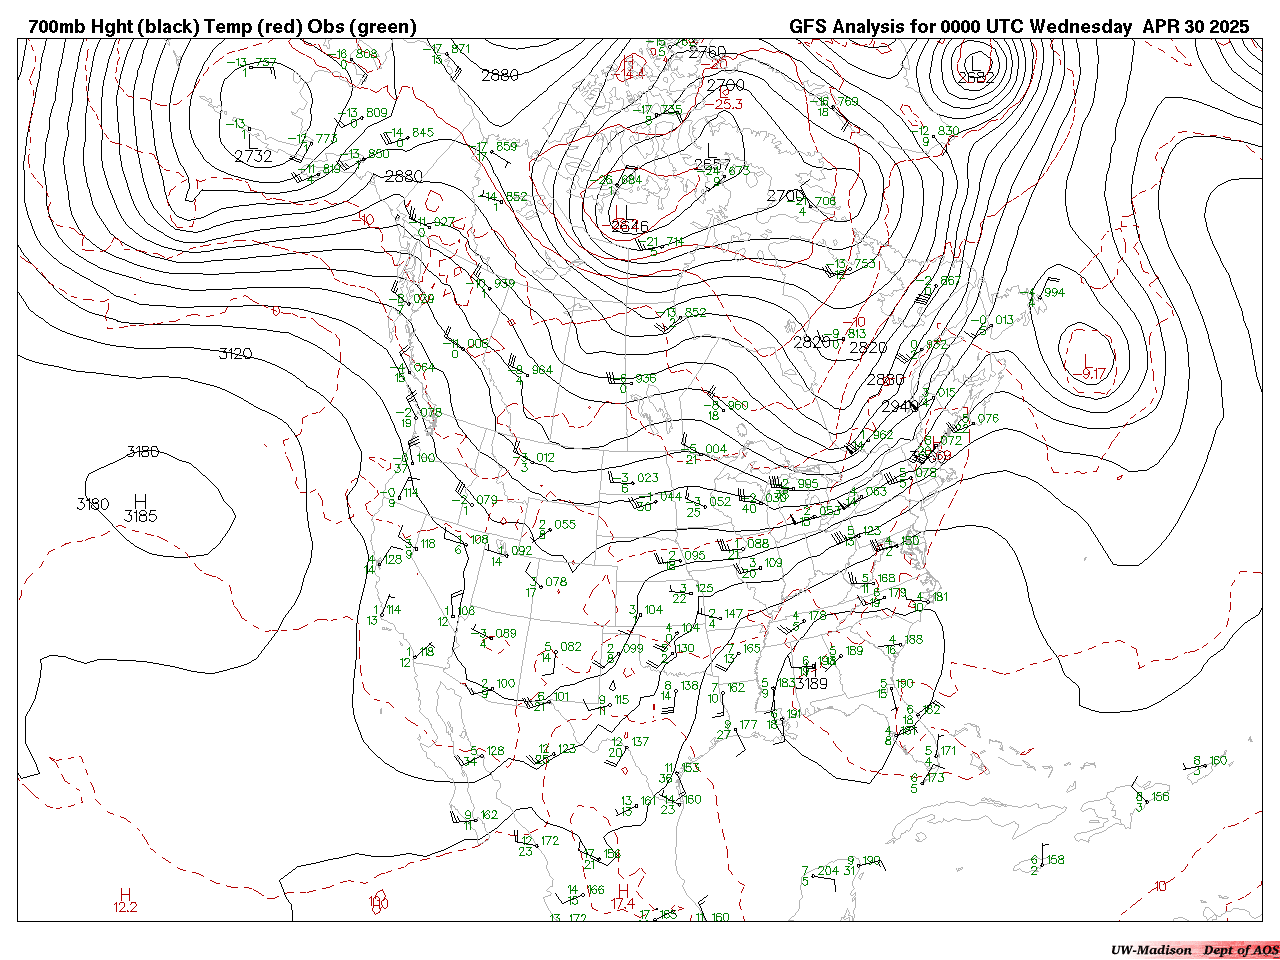
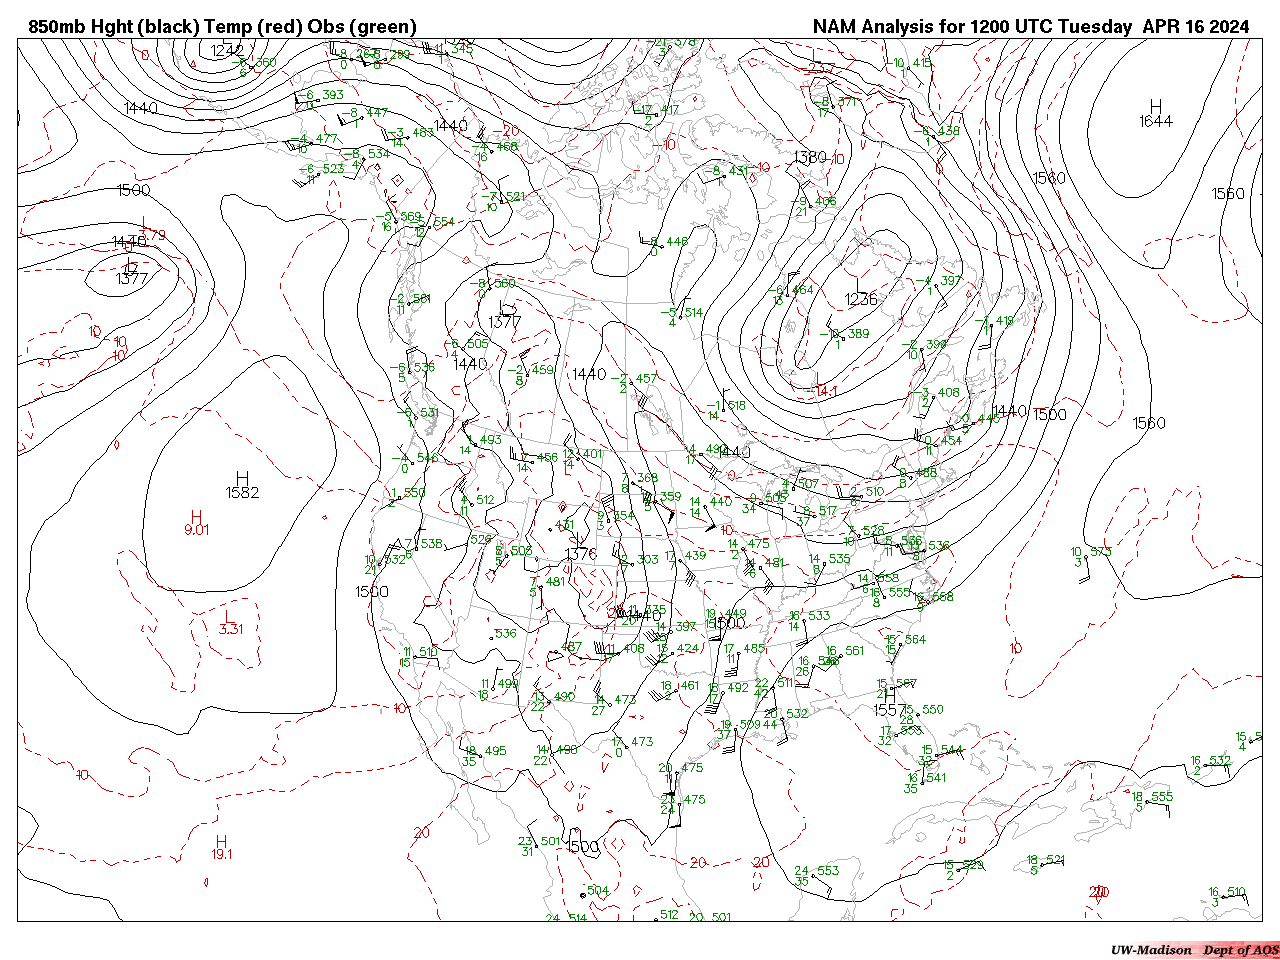
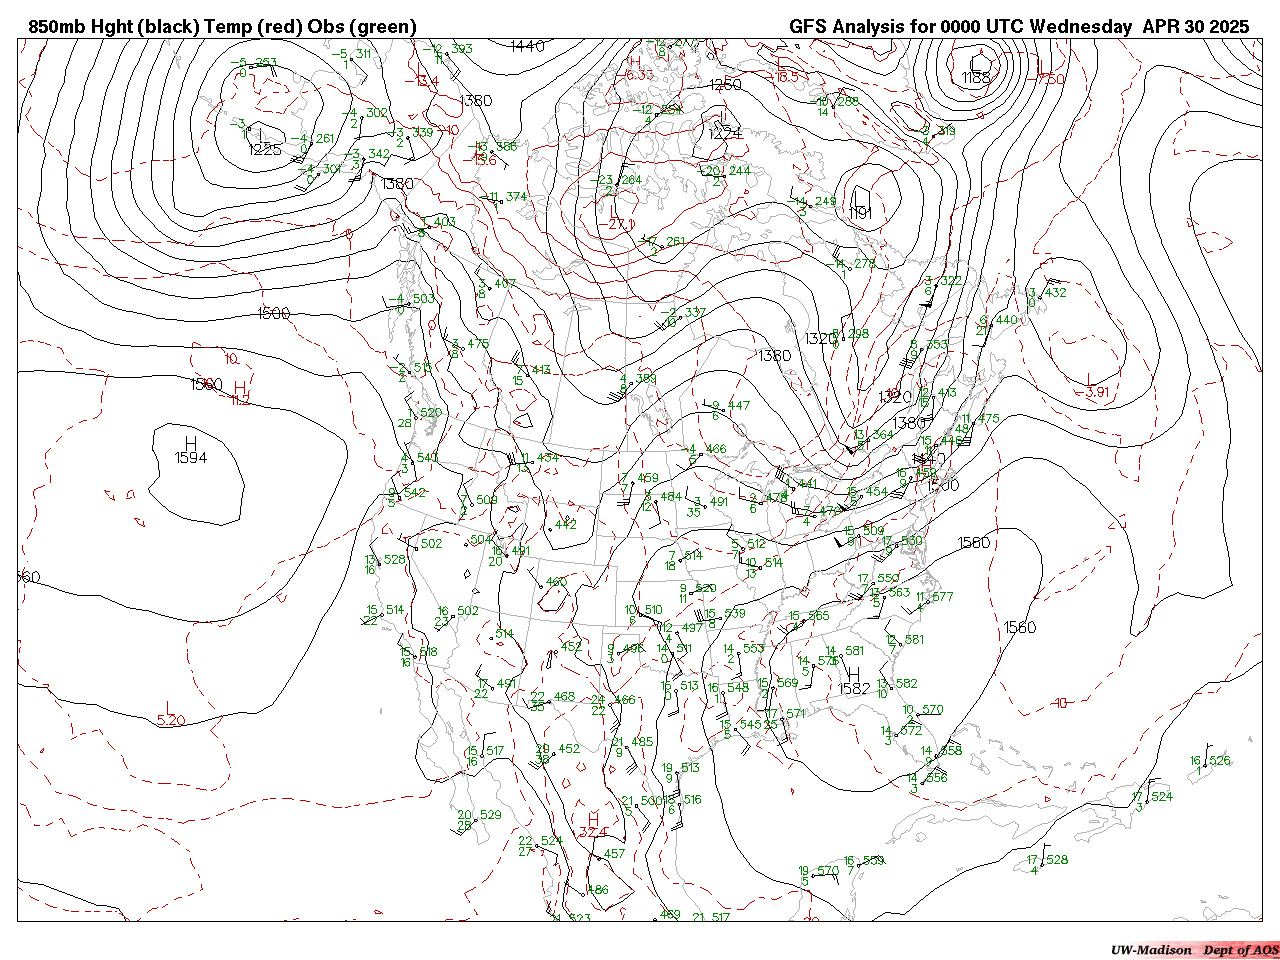
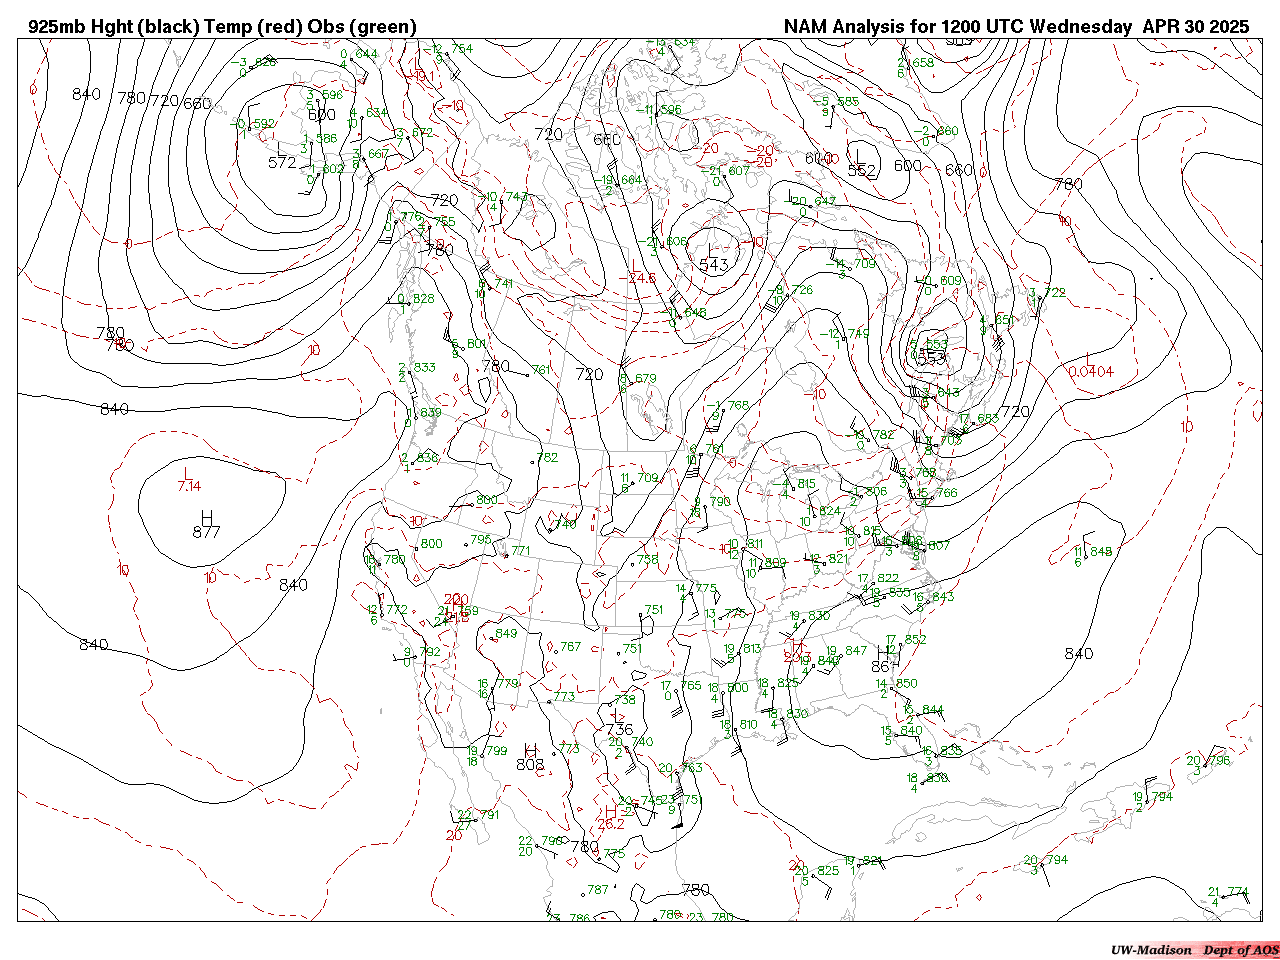
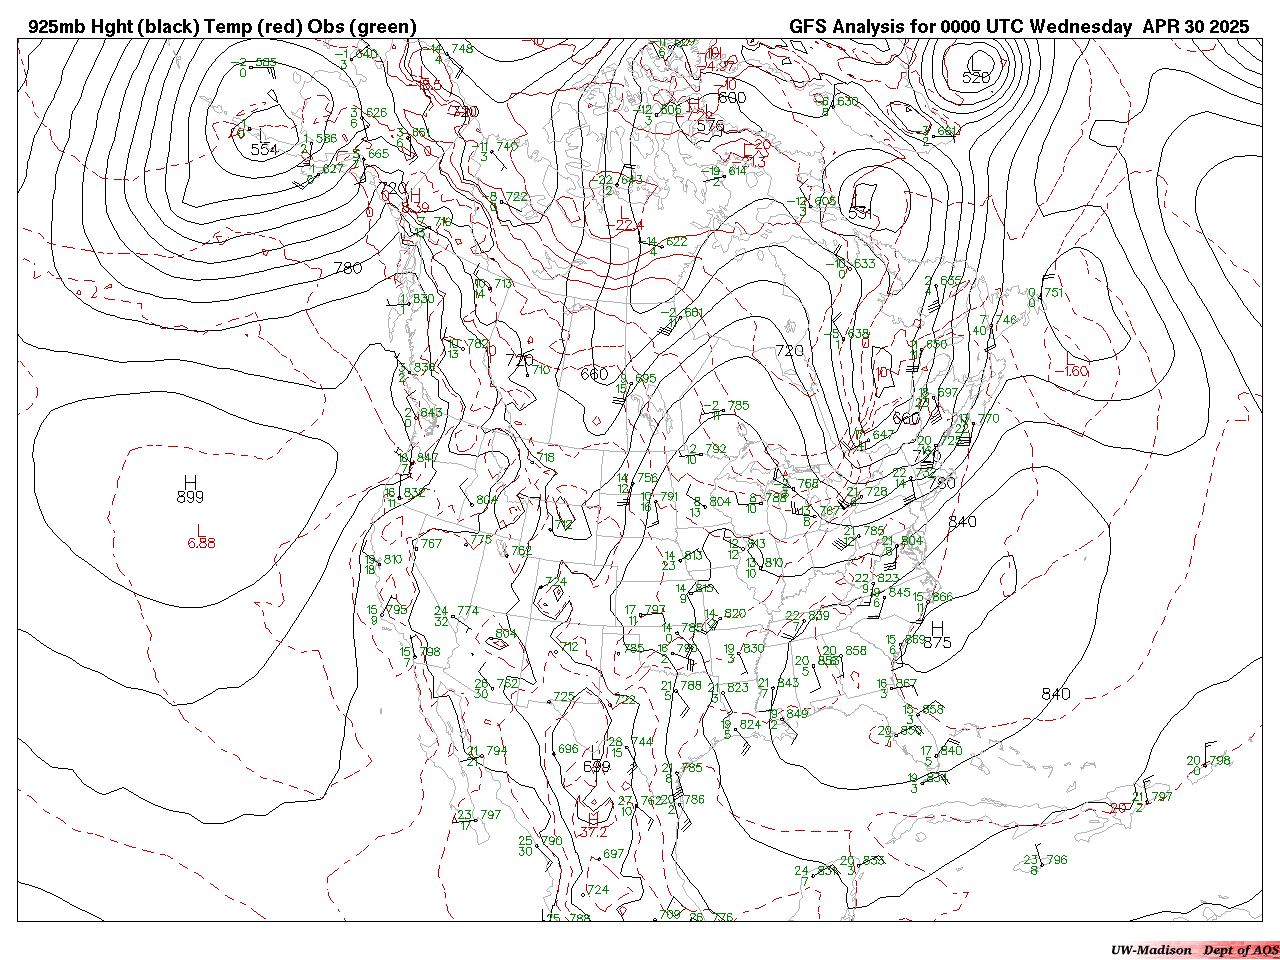
Most recent observations with analysis from the NCEP NAM or GFS model
| With NAM analysis | With GFS Analysis | |
|---|---|---|
| 100 hPa | Image | Loop | Image | Loop |
| 150 hPa | Image | Loop | Image | Loop |
| 200 hPa | Image | Loop | Image | Loop |
| 250 hPa | Image | Loop | Image | Loop |
| 300 hPa | Image | Loop | Image | Loop |
| 400 hPa | Image | Loop | Image | Loop |
| 500 hPa | Image | Loop | Image | Loop |
| 700 hPa | Image | Loop | Image | Loop |
| 850 hPa | Image | Loop | Image | Loop |
| 925 hPa | Image | Loop | Image | Loop |