#1. Radiation of planetary waves from tropical convection


Planetary Wave Trains

Picture 1


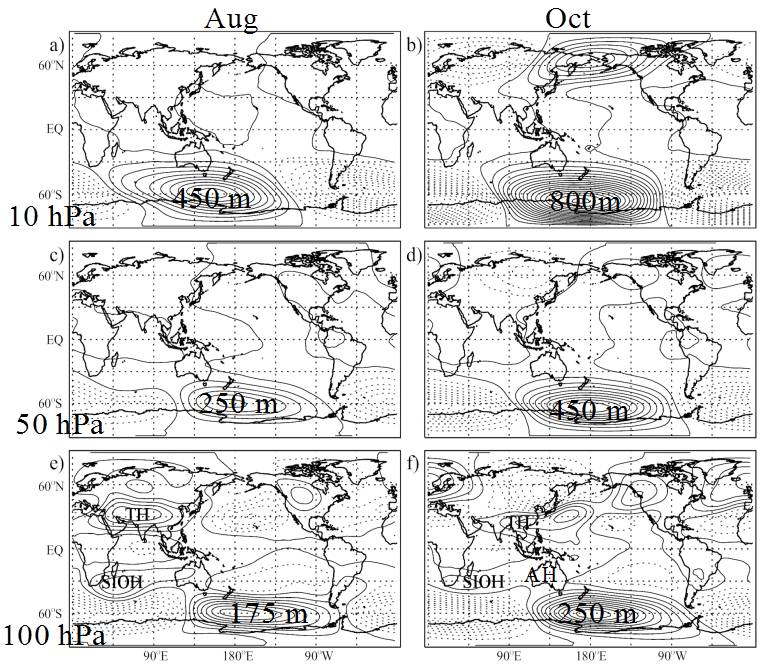
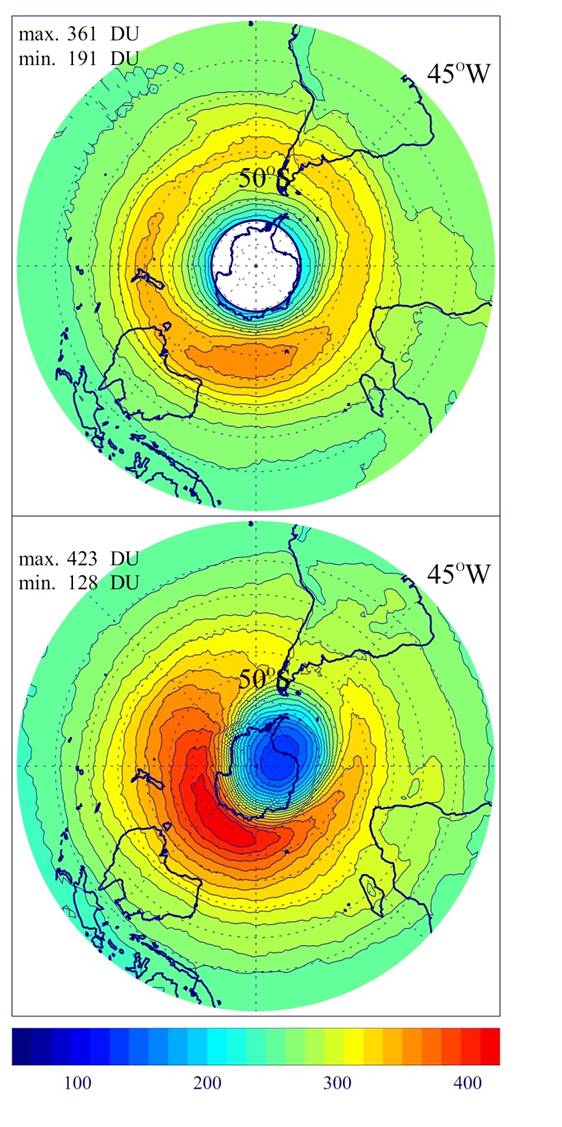
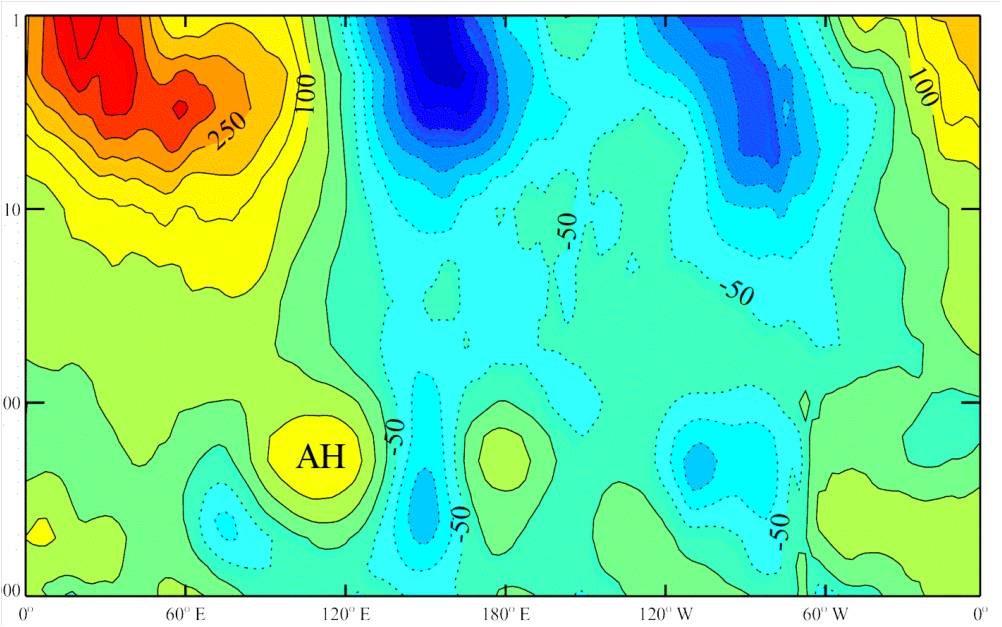
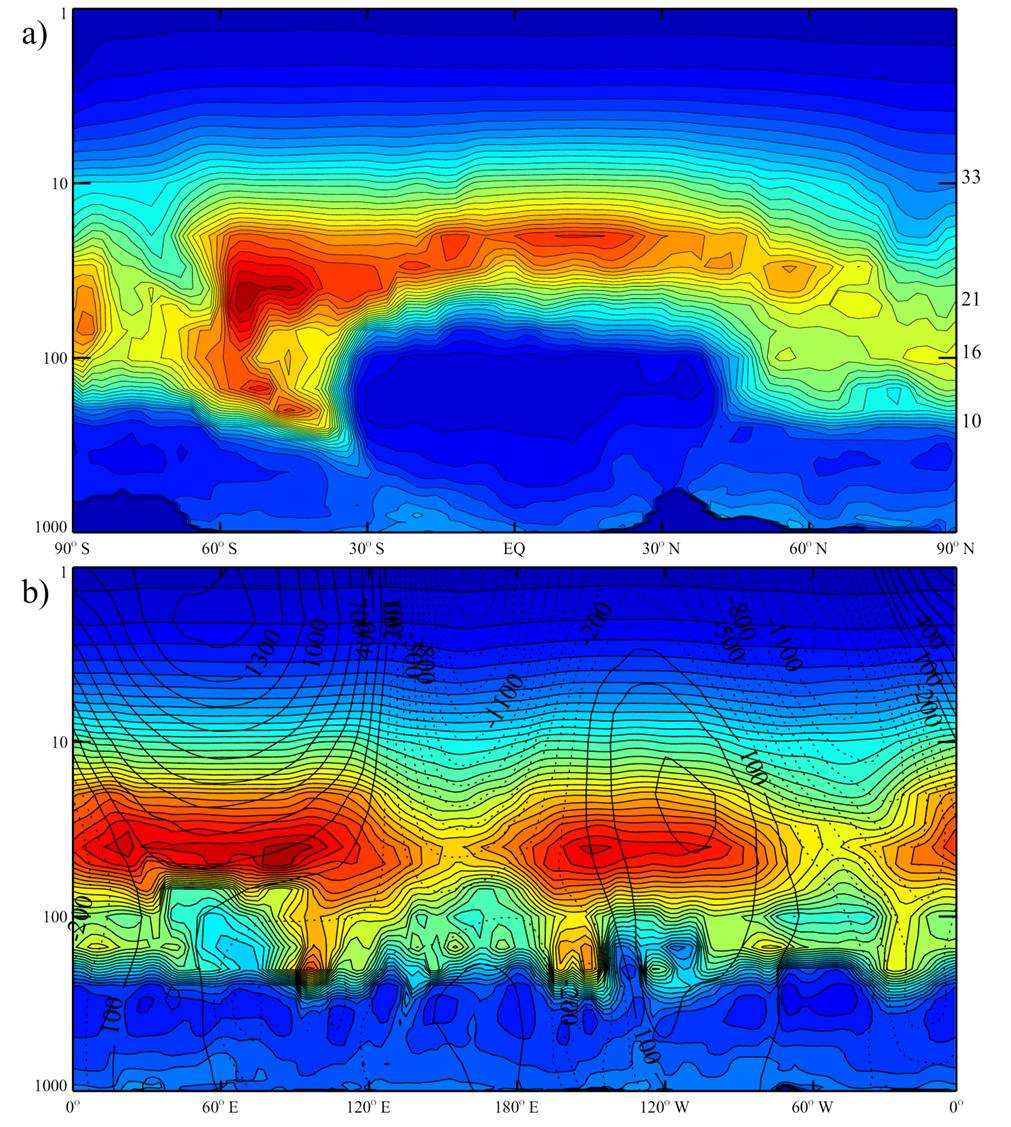
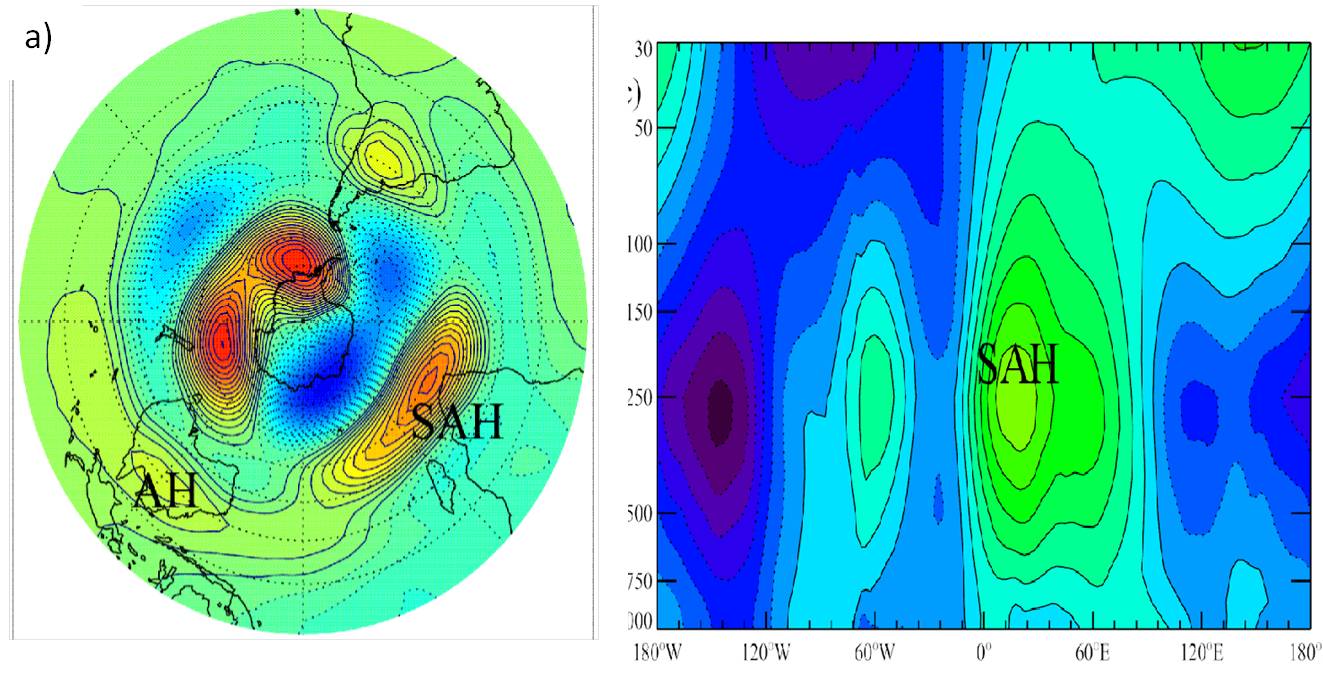
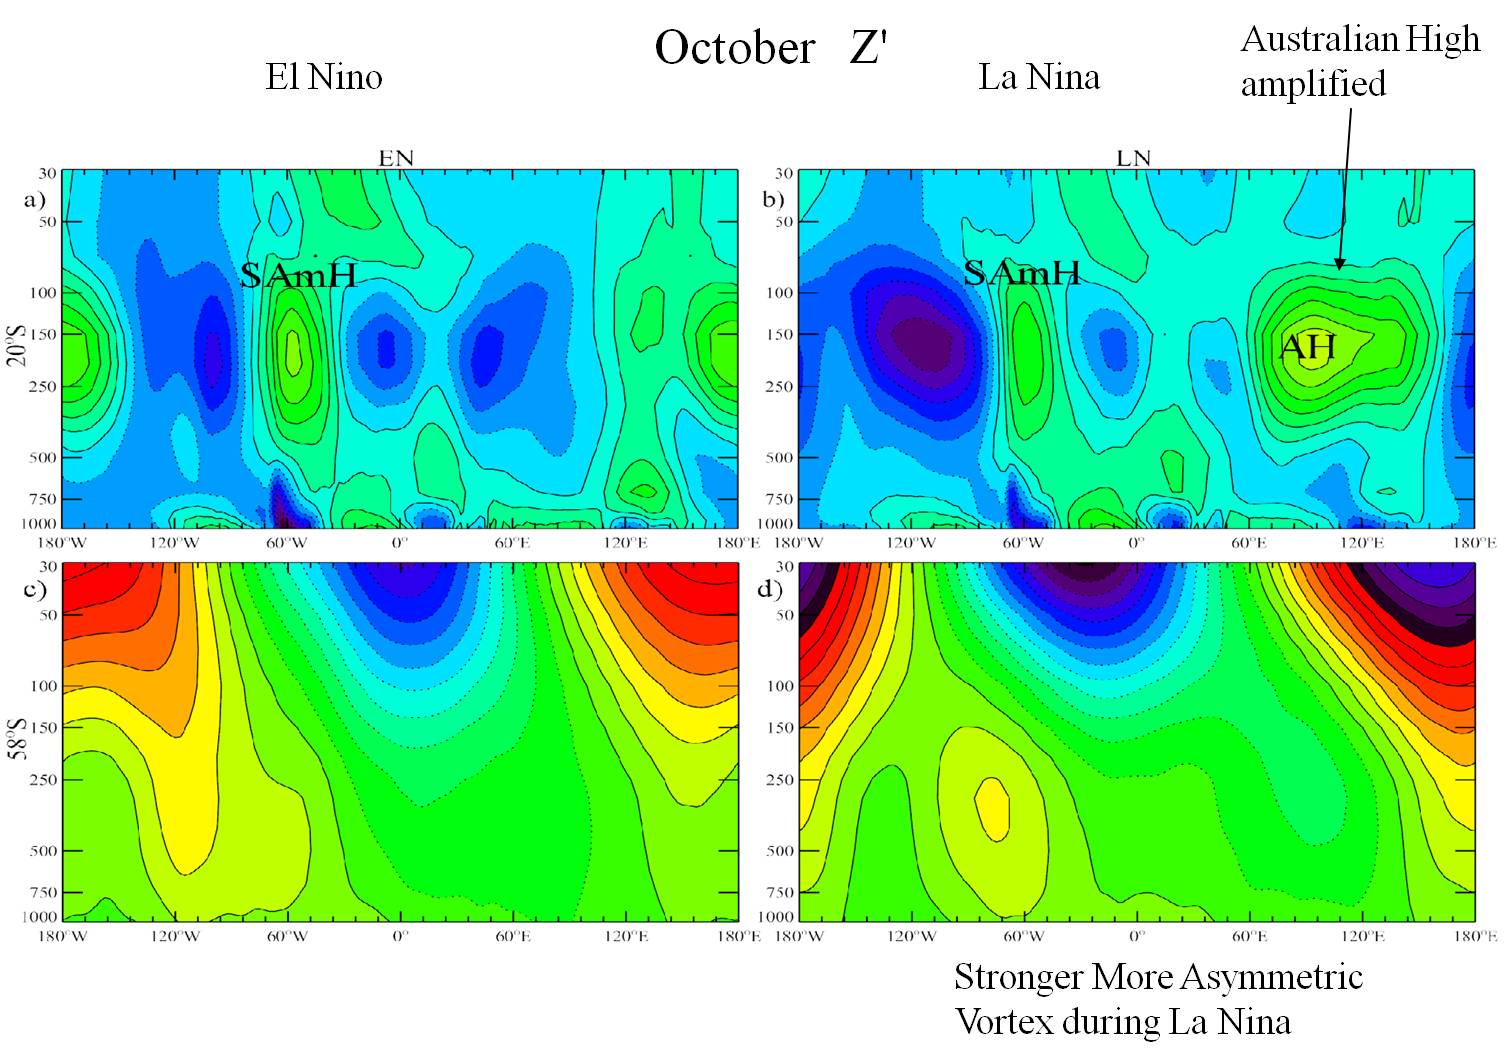
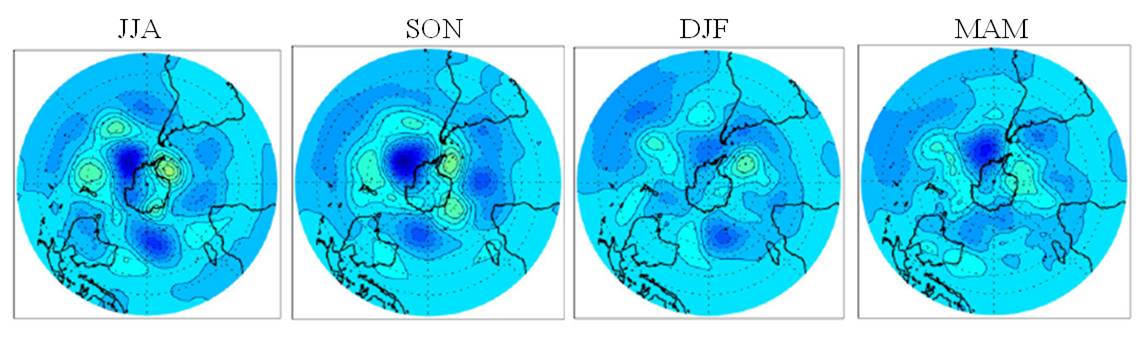
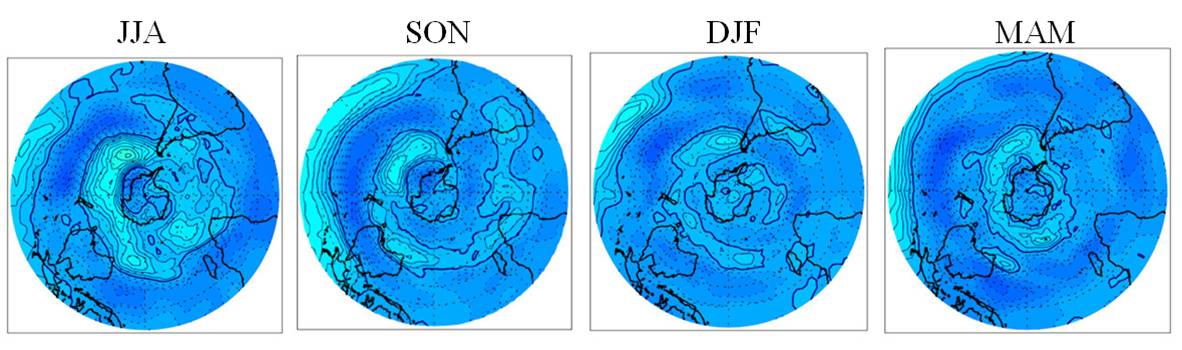
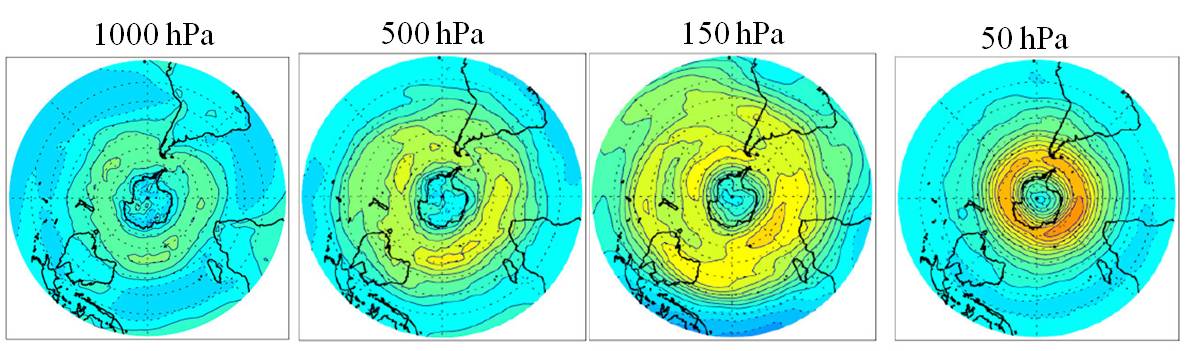
Figure 1. ECMWF monthly mean height anomalies (1995-2004) show the wave train that emanates from convection near Indonesia, propagates energy poleward in the UTLS (panels e,f), then upward into the austral stratosphere (c,d a,b). This amplifies from August to October as zonal winds weaken during SH spring. Ozone-rich air is found in the ridge over the South Pacific. (cf. Hitchman and Rogal, 2009a,b; Rogal et al., 2010).


Picture 2


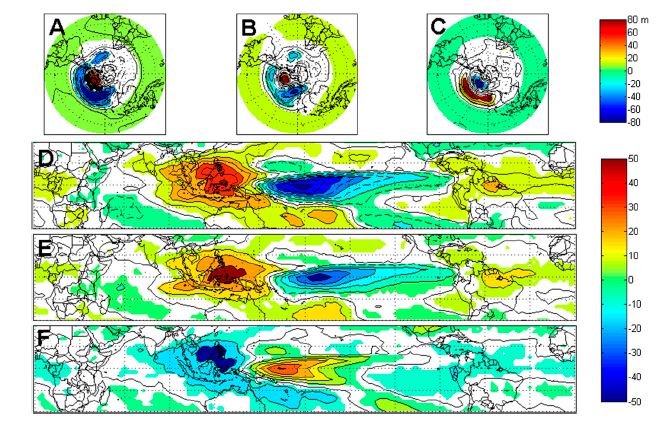
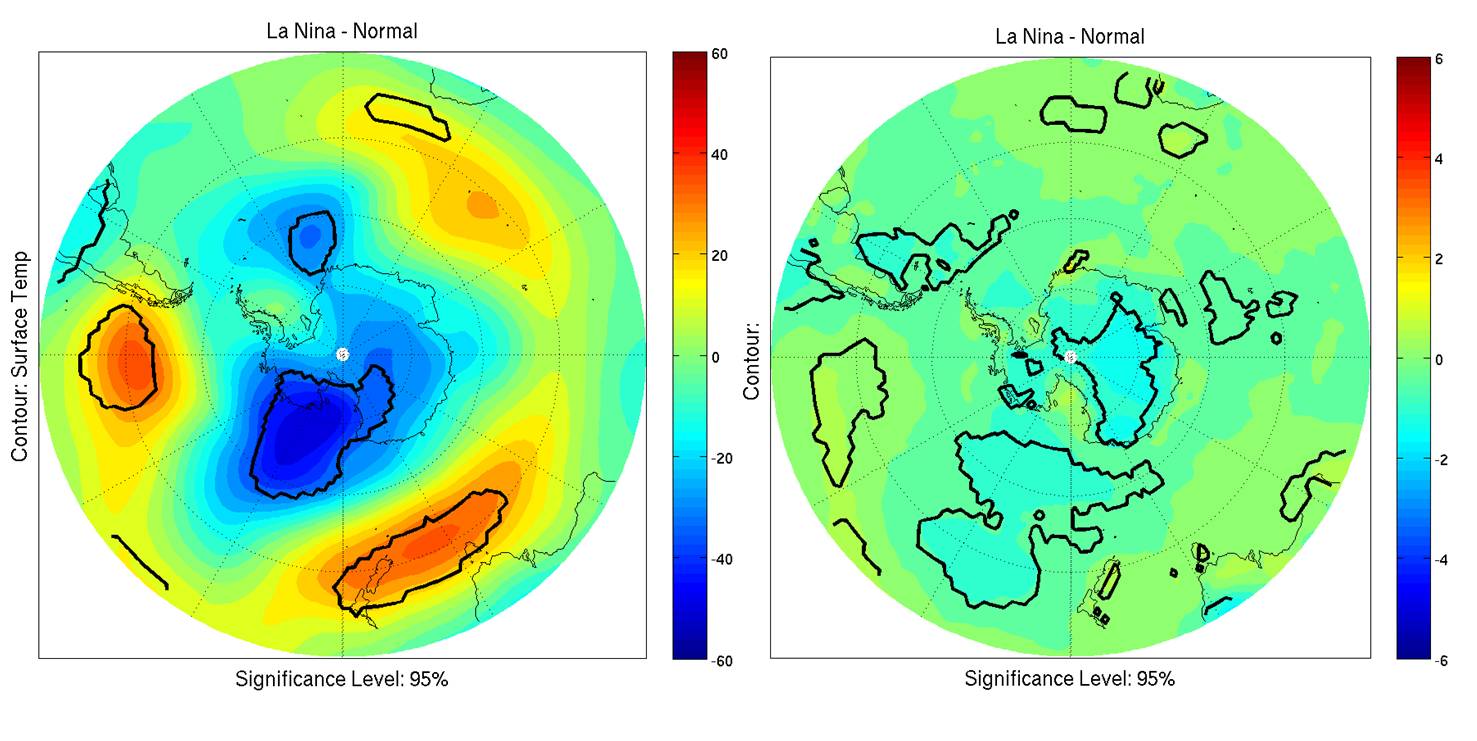
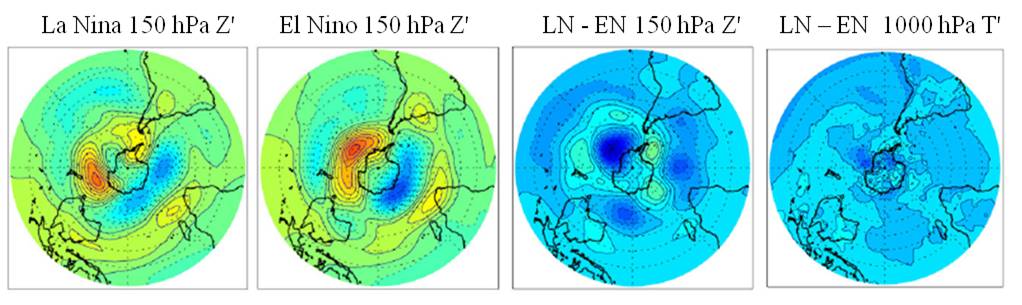
Figure 2. ENSO modulates the distribution of clouds in the Indian Ocean - Pacific Ocean region, with the center of change near Indonesia. This modulates the distribution of height anomalies in the Southern Hemisphere. Top: Annually averaged 500 hPa geopotential height anomalies (m) for a) El Nino minus La Nina, b) El Nino minus neutral, and c) La Nina minus neutral, with regions of statistical significance exceeding the 95% confidence level represented in color. d), e), f) same except for NOAA OLR anomalies (W per m2). Solid (dashed) contours indicate positive (negative) values. Note that in the Ross Sea area geopotential heights are anomalously high during El Nino and low during La Nina (Welhouse et al., 2016).

Picture 3 Picture 4 Picture 5


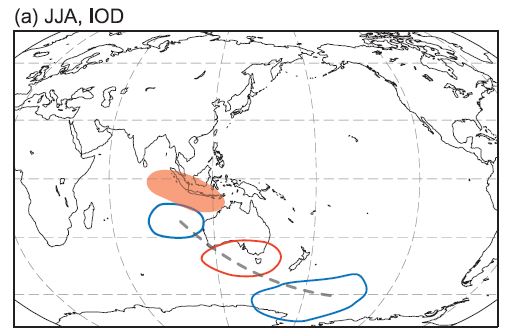
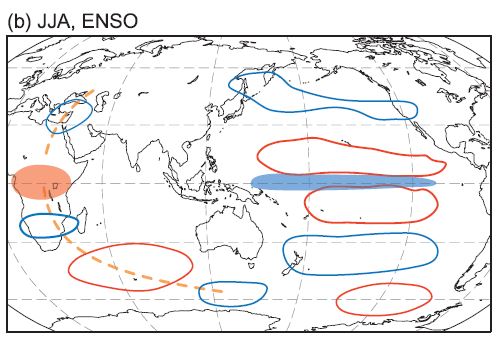
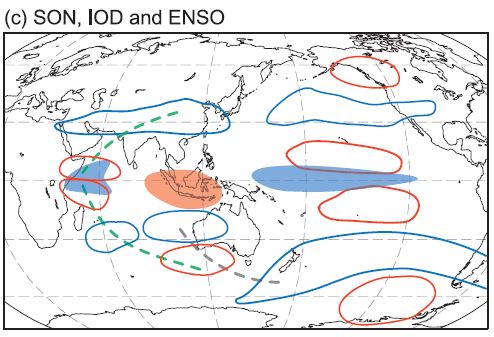
Figure 3. Some authors have explored dividing differences in the source region for planetary waves from different parts of the tropics. This schematic illustration shows typical wave trains associated with the (a) Indian Ocean Dipole (IOD) and (b) ENSO for JJA and (c) for the IOD and ENSO together for SON. This description is for positive phases of the IOD and El Nino. Typically opposite patterns occur during negative IOD and La Nina. Shaded blue (red) areas indicate regions of increased (decreased) tropical convection. Blue (red) contours indicate anomalously low (high) upper-level heights. The dashed lines trace prominent wave trains: gray for the Eastern Indian Ocean wave train, green for the Western Indian Ocean wave train, and orange for the Equatorial African wave train. The PNA and PSA wave trains are not marked but visible in (b) and (c) (Cai et al., 2011).

#2. Seasonal shift in long waves and column ozone from winter to spring


Picture 6 Picture 7

Figure 4. Total Ozone Mapping Spectrometer column ozone distribution for JJA and SON. Column ozone maximizes poleward of the Australian Subtropical Westerly Jet in the subsidence warm anomaly (cf. idealized linear model by Wirth, 1993). The *geographical location* of the ozone croissant and associated wave one structure is partly controlled by convection in Southeast Asia, since outflow in the UTLS creates the subtropical westerly jet that extends across the Pacific (Hitchman and Rogal, 2010).


Picture 1

Figure 5. Another significant contributor to the enhanced Pacific column ozone maximum during SON is the interaction of Indonesian UTLS outflow pulses with travelling wave two in the SH stratosphere. An outflow pulse will cause the wave two to stall, with an amplification of the wave two ridge nearest to Indonesia. An example is shown in this longitude-altitude section from the surface to the stratopause of eddy geopotential height at 22 degrees S on 24 August 2000, contour interval 50 (Hitchman and Rogal, 2009).

Picture 1

Figure 6. a) Latitude - altitude section at 95E on 24 August 2000 of ozone mixing ratio in ppmv. Stratospheric ozone is seen to maximize just poleward of the subtropical jet near the tropopause. b) Longitude - altitude section at 38S showing the coincidence of high ozone values (color, ppmv) and high geopotential height (contour interval 150 m), consistent with circulation of ozone poleward and downward around planetary anticyclones. Averaged over many such events, Indonesian outflow pulses preferentially amplify the nearest wave two height maximum, contributing to the column ozone maximum in the high latitude Pacific (Hitchman and Rogal, 2009).

Back to top of page

#3. ENSO shift in long waves and column ozone from winter to spring


Figure 7. During ASO, there is a strong longtitudinal shift in the maximum in TOMS column ozone (averaged in the latitude band 45-60S), corresponding to the longitudinal shift in convection (cf. Fig. 2). During La Nina (green), SH column ozone shifts westward, along with the convection. During El Nino (blue), SH column ozone shifts eastward. 6 La Ninas (green) and 7 El Ninos (blue) were averaged for the period 1982 - 2004. This is further evidence of the primacy of Indonesian convection in affecting the Antarctic planetary wave pattern (Hitchman and Rogal, 2010). The reason for the westward shift during LN depends on the month.


Picture 8

Figure 8. In September El Nino favors a strong South African High (SAH) in the subtropical UTLS, as seen in eddy geopotential height at a) 150 hPa and b) 35 degrees S. This displaces the tropopause upward, causing a cold anomaly in the lower stratosphere and reduced column ozone, shifting the ozone maximum toward the Eastern Pacific (Hitchman and Rogal, 2010).

Figure 9. In October La Nina favors a strong Australian High (AH) in the subtropical UTLS (Fig. 9b). Longitude - altitude sections of eddy geopotential height are shown for El Nino (left) and La Nina (right) at 20S (upper) and 58S (lower). Note the westward shift of the geopotential height pattern at higher latitudes during La Nina, corresponding to the westward shift of column ozone (Fig. 7) and westward shift of convection (Fig. 2). During La Nina the polar vortex is stronger and more asymmetric (Hitchman and Rogal, 2010).

Back to top of page

#4. ENSO differences in wind, height and temperature by season


La Nina cools East Antarctica

Figure 10. A primary result of Welhouse et al. (2016) is that there is a barotropic cold anomaly over the Ross Sea and East Antarctic sector. At left is shown 500 hPa height anomalies for La Nina minus neutral during NDJ, while 2 meter temperature anomalies are shown at right.


Figure 11. The seasonal dependence of the La Nina minus El Nino 150 hPa geopotential height anomalies using ECMWF data from 1985-2009. During La Nina 150 hPa geopotential heights in the high latitude Pacific are lower than during El Nino near the Ross Sea (90-180W) in every season, with the signal being smallest during SH summer (DJF).

Figure 12. La Nina minus El Nino 150 hPa zonal wind differences using ECMWF data from 1985-2009 (contour interval 5 m/s) are shown for each season. During La Nina 150 hPa zonal winds are stronger near 50S, with the effect being weakest during summer.

Figure 13. 150 hPa geopotential height anomaly for a) La Nina, b) El Nino, c) La Nina minus El Nino, and La Nina minus El Nino 1000 hPa temperature anomaly for SON, using ECMWF data from 1985-2009. These plots highlight the warm, deep barotropic high near the Ross Sea during El Nino, contrasting with the cooler, deep barotropic low during La Nina

The vertically continuous nature of the westerly jet at high latitudes is shown in these plots of zonal wind speed (contour interval 5 m/s) during La Nina and SON using daily ECMWF data from 1985-2009. These plots show that the polar night vortex at 50 hPa is vertically continuous down to the surface, with enhancement by the subtropical jet in the UTLS due to convective outflow from Indonesia (cf. 150 hPa level).

Back to top of page

#5. Conclusions


During La Nina:

  • Column ozone maximum shifted westward ~50 degrees
  • Stronger poleward wave activity flux from Indonesia
  • Stronger planetary wave one
  • Stronger polar vortex
  • Colder East Antarctica
  • Enhanced Ross Sea low

During El Nino

  • Column ozone maximum shifted eastward ~50 degrees
  • Weaker poleward wave activity flux from Indonesia
  • Weaker planetary wave one
  • Weaker polar vortex
  • Warmer East Antarctica
  • Higher pressure over the Ross Sea

Back to top of page

#6. Future Work


Under Construction: Collaboration with

  • Takenari Kinoshita
    National Institute of Information and Communications Technology, Japan

  • Prof. Kaoru Sato
    University of Tokyo, Japan

We are investigating changes in fluxes of Rossby wave Energy out of the tropics in the UTLS into the SH

The UTLS is a conduit whereby tropical convection can Influence the propagation of extratropical planetary wave Activity through the connecting westerly waveguide

Back to top of page