|
Water Systems & Climate
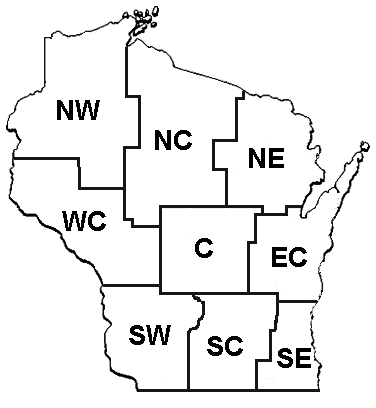
Statewide Precipitation
Monthly 2016 Statewide Maps -
Courtesy of Midwestern Regional Climate Center
- Precipitation (inches) - and departures from 1981-2010 Normals
See
archive of statewide monthly precipitation maps for previous years (2001-2015)
- Snow to Liquid Water Ratio
Climatology (1971-2000) -- St. Louis University
-
Heavy Precipitation Frequency
- Local Storm Reports and case study reports for Flooding events in:
Statewide Evaporation
Statewide Drought Indicators
Palmer Drought Severity Index (PDSI; explanation)
- VegDRI (Vegetation Drought Response Index) from NDMC
Regional Soil Moisture & Drought
National Drought Information
- VegDRI (Vegetation Drought Response Index) from NDMC
Current Keetch-Byram Drought Index Map
- US Drought Portal from National Integrated Drought Information System (NIDS)
- USGS's Drought Watch
- NOAA Paleoclimatology Reconstruction of Past Drought for the US (1700-1995)
- CPC Drought Monitoring: Indices and Diagnostics (from the North American Regional Reanalysis)
- USGS Drought Monitoring Dynamic Map Interface
- NLDAS Drought Monitor (NASA's Goddard Space Flight Center North American Land Data
Assimilation System)
- Drought Monitoring and Hydrologic Forecasting with VIC from Princeton University
- Weekly Report - Water and Climate Update - Natural Resources Conservation Service
- Droughts in North America
A
three-page fact sheet (2011)
in pdf format from Earth Gauge (National Environmental Education Foundation).
** The Drought Intensity Categories classification scheme used by NDMC on their National, Regional and State Drought Monitor maps is provided.
***The Palmer Drought Severity Index is based upon
Palmer, W.C., 1965: Meteorological drought. Research Paper 45, US Weather Bureau, Dept. of Commerce, Washington, DC. 58 pp.
Available at https://www.ncdc.noaa.gov/temp-and-precip/drought/docs/palmer.pdf
Palmer, W.C., 1988 (12 Jul): The Palmer Drought Index: When and how it was developed. Weekly Weather and Crop Bulletin, 75 (28), 5.
Available at https://usda.mannlib.cornell.edu/usda/waob/weather_weekly//1980s/1988/weather_weekly-07-12-1988.pdf
National Soil Moisture Information
National Atmospheric Moisture Content
- National Precipitable Water Plots from NWS radiosonde network
Includes station plots and analyzed maps updated through 2011
(Courtesy of NWSFO at Rapid City)
National Precipitation
Great Lakes & State Lake Levels
Surface & Drinking Water
National Water Systems Forecasts
Runoff and Floods
|


