|
ACCESSING WEATHER AND CLIMATE DATA
FILES FROM
WISCONSIN STATE CLIMATOLOGY OFFICE
BY EDUCATORS
Prepared by Edward J. Hopkins, PhD,
Assistant Wisconsin State Climatologist
as of 17 April 2010
Introduction
This document identifies some of the data files that we have posted on the
Wisconsin State Climatology Office website that you can use to assess the
current and past climate of Wisconsin, as well as other neighboring states.
Many of the files that have been posted are in the comma-delimited text format
(as noted by the csv file name extender), which means that you can save the file
and then you can import these easily into a spreadsheet environment (e.g., Excel
or xls format) for data analysis. If you have questions, please feel free to
contact us.
Edward J. Hopkins
John A. Young
Lyle J. Anderson
Statewide and Divisional
Data
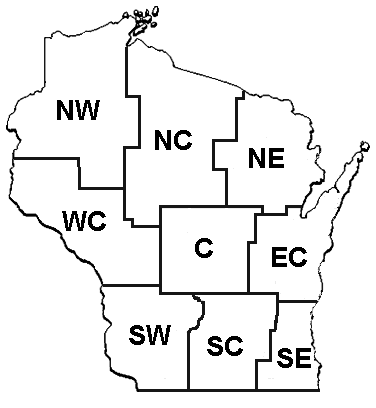
Wisconsin has nine climate divisions, arranged according to

(Map
from
https://www.aos.wisc.edu/oldsco/images/wis-divisions.GIF)
You can access the divisional and statewide climate data generated by the National
Climatic Data Center (NCDC) for all months running from 1895 to the present for
your data analysis and for generation of graphics
such as found at
https://www.aos.wisc.edu/oldsco/clim-history/state/graphics/WI-temp-annual.gif
:
The format for these data sets includes columns that are arranged as:
Year – from 1895 to present,
Months – 12 columns for data, arranged from
January to December, except for snowfall data (where July-June sequence is
used),
ANNUAL – The 12-month annual average
temperature or precipitation (snowfall) totals,
MAX – Maximum monthly value for the year;
MIN – Minimum monthly value for the year,
COUNT – The number of monthly values for the
year,
Seasonal averages (or totals) and 5-year
running averages (centered on the year) for
MAM –Spring (March, April, May)
JJA – Summer (June, July, August)
SON – Autumn (September, October, November)
DJF – Winter (December, January, February of following year)
ANN (5yr) – Annual
GRW SEA (AMJJAS) Growing Season (April through September)
NONGRW (ONDJFM) Non-growing Season (October through
following March)
WATER YEAR (Oct-Sep),
Jan-Jun—First half of calendar year
Jul-Dec—Second half of calendar year
Jul-Jun –Year arranged for snow or heating season,
Multiple year Summaries: Under the last year of data, summaries are available
that include such statistics as multi-year averages, medians, standard
deviation data, extremes and counts for the following groups of time:
1895 to present, 1901-2000, 1951-2000,
1971-2000, 1961-1990, 1951-1980,…1901-1930
TEMPERATURE
(1895-present) :
Statewide: --
comma-delimited
or
spreadsheet
Northwest --
comma-delimited or
spreadsheet
North central --
comma-delimited or
spreadsheet
Northeast --
comma-delimited or
spreadsheet
West central --
comma-delimited or
spreadsheet
Central --
comma-delimited or
spreadsheet
East central --
comma-delimited or
spreadsheet
Southwest --
comma-delimited or
spreadsheet
South central --
comma-delimited or
spreadsheet
Southeast --
comma-delimited or
spreadsheet
PRECIPITATION
(1895-present) :
Statewide: --
comma-delimited or
spreadsheet
Northwest --
comma-delimited or
spreadsheet
North central --
comma-delimited or
spreadsheet
Northeast --
comma-delimited or
spreadsheet
West central --
comma-delimited or
spreadsheet
Central --
comma-delimited or
spreadsheet
East central --
comma-delimited or
spreadsheet
Southwest -- comma-delimited or
spreadsheet
South central --
comma-delimited or
spreadsheet
Southeast --
comma-delimited or
spreadsheet
SNOW:
MONTHLY SNOW*
Statewide: --
comma-delimited or
spreadsheet
Northwest --comma-delimited
North central --
comma-delimited
Northeast --
comma-delimited
West central --
comma-delimited
Central --
comma-delimited
East central --
comma-delimited
Southwest --
comma-delimited
South central --
comma-delimited
Southeast --
comma-delimited
* For statewide averages, snowfall 1895-present; for divisions – 1950 to
present
Note: Data arranged according to snow season (July to June),
Palmer Drought Severity Index (PDSI)
Northwest
--
comma-delimited
North central --
comma-delimited
Northeast --
comma-delimited
West central --
comma-delimited
Central --
comma-delimited
East central --
comma-delimited
Southwest --
comma-delimited
South central --
comma-delimited
Southeast --
comma-delimited
Statewide: --
comma-delimited
No five-year running means
for seasons or annual.
DEGREE DAYS
(1895-present) (area weighted)
HEATING DEGREE DAY
UNITS
(area weighted)
Statewide:
--
comma-delimited or spreadsheet
Northwest --
comma-delimited
North central --comma-delimited
Northeast --
comma-delimited
West central --
comma-delimited
Central --
comma-delimited
East central --
comma-delimited
Southwest --
comma-delimited
South central --
comma-delimited
Southeast --
comma-delimited
COOLING DEGREE
DAY UNITS (area weighted)
Statewide:
--
comma-delimited or spreadsheet
Northwest --
comma-delimited
North central --
comma-delimited
Northeast --
comma-delimited
West central --
comma-delimited
Central --
comma-delimited
East central --
comma-delimited
Southwest --
comma-delimited
South central --
comma-delimited
Southeast --
comma-delimited
1971-2000 NORMAL DATA
NORMALS: see below
https://www.aos.wisc.edu/oldsco/clim-history/sta-data/normals/WI-81-7100norms-temp.csv
https://www.aos.wisc.edu/oldsco/clim-history/sta-data/normals/WI-81-7100norms-precp.csv
https://www.aos.wisc.edu/oldsco/clim-history/sta-data/normals/WI-81-7100norms-ddu.csv
https://www.aos.wisc.edu/oldsco/clim-history/sta-data/normals/WI-81-7100norms-Snowfall.csv
Comma-delimited files
containing 1971-2000 normal data for liquid equivalent precipitation in inches:
https://www.aos.wisc.edu/oldsco/clim-history/sta-data/normals/WI-81-7100norms-precp.csv
along with the "normal" number of days that have precip totals exceeding, 0.01
inches (measurable), 0.10 inches, 0.50 inches and 1.00 inches.
https://www.aos.wisc.edu/oldsco/clim-history/sta-data/normals/WI-precipdaysGE001.csv
https://www.aos.wisc.edu/oldsco/clim-history/sta-data/normals/WI-precipdaysGE010.csv
https://www.aos.wisc.edu/oldsco/clim-history/sta-data/normals/WI-precipdaysGE050.csv
https://www.aos.wisc.edu/oldsco/clim-history/sta-data/normals/WI-precipdaysGE100.csv
Normal maximum, minimum
and average temperatures in degrees Fahrenheit (but for a smaller number of
stations):
https://www.aos.wisc.edu/oldsco/clim-history/sta-data/normals/WI-81-7100norms-temp.csv
Normal heating and
cooling degree days in degrees Fahrenheit
https://www.aos.wisc.edu/oldsco/clim-history/sta-data/normals/WI-81-7100norms-ddu.csv
Normal monthly and
seasonal snowfall in Wisconsin
https://www.aos.wisc.edu/oldsco/clim-history/sta-data/normals/WI-81-7100norms-Snowfall.csv
Normal number of days
that a certain threshold for snow cover is met and exceeded.
https://www.aos.wisc.edu/oldsco/clim-history/sta-data/normals/WI-snwcovdays.csv
https://www.aos.wisc.edu/oldsco/clim-history/sta-data/normals/WI-snwdays.csv
STATEWIDE EXTREMES DATA
Comma-delimited files of
statewide monthly temperature extremes (1885- present):
Highest monthly temperatures:
https://www.aos.wisc.edu/oldsco/clim-history/state/wi-ex-t-max.csv
Lowest monthly temperatures:
https://www.aos.wisc.edu/oldsco/clim-history/state/wi-ex-t-min.csv
Comma-delimited files of
statewide monthly precipitation extremes (1885- present):
Max monthly precipitation:
https://www.aos.wisc.edu/oldsco/clim-history/state/wi-r-mo-max.csv
Min monthly precipitation:
https://www.aos.wisc.edu/oldsco/clim-history/state/wi-r-mo-min.csv
24-hr max precipitation:
https://www.aos.wisc.edu/oldsco/clim-history/state/wi-r-24h-max.csv
Comma-delimited files of
monthly snow extremes:
Max monthly snowfall:
https://www.aos.wisc.edu/oldsco/clim-history/state/wi-s-maxmo.csv (1896/97-
present)
Max monthly snow cover:
https://www.aos.wisc.edu/oldsco/clim-history/state/wi-scov-maxmo.csv
(1948/49-present)
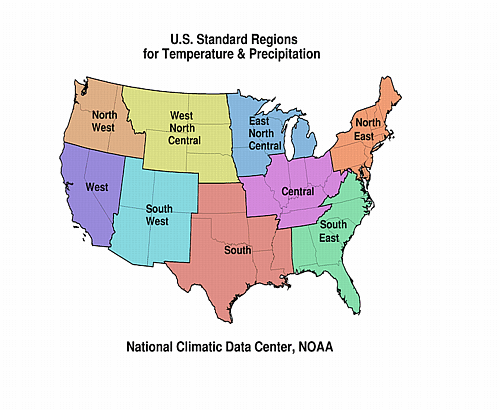
US-National
Monthly and annual area-average temperature
and precipitation data are available for the nine regions of the continental
United States.

Map from
https://www.aos.wisc.edu/oldsco/clim-history/national/usrgns_pg.gif
In addition, monthly data are available for
the entire US.
Data
files for temperature (1895-present)
Northeast -
comma-delimited or
spreadsheet
East North Central -comma-delimited
or
spreadsheet
Central --
comma-delimited or
spreadsheet
Southeast --
comma-delimited or
spreadsheet
West North Central --
comma-delimited or
spreadsheet
South --
comma-delimited or
spreadsheet
Southwest --
comma-delimited or
spreadsheet
Northwest --
comma-delimited or
spreadsheet
West --
comma-delimited or
spreadsheet
CONUS (Lower 48) --
comma-delimited or
spreadsheet
Data
files for precipitation (1895-present)
Northeast -
comma-delimited or
spreadsheet
East North Central -
comma-delimited or
spreadsheet
Central --
comma-delimited or
spreadsheet
Southeast --
comma-delimited or
spreadsheet
West North Central --
comma-delimited or
spreadsheet
South --
comma-delimited or
spreadsheet
Southwest --
comma-delimited or
spreadsheet
Northwest --
comma-delimited or
spreadsheet
West --
comma-delimited or
spreadsheet
CONUS (Lower 48) --
comma-delimited or
spreadsheet
|


