Weekly Ocean News
2-6 April 2018
ITEMS
OF INTEREST
- Chinese space station reenters Earth's atmosphere -- Tiangong-1, China's school-bus sized space station that had been in orbit around the Earth since November 2011, finally reentered the atmosphere on Sunday evening (0016Z on 2 April, or 8:16 PM EDT on the first). According to the U.S. Strategic Command's Joint Force Space Component Command, Tiangong-1 broke apart as it traveled into the atmosphere over the southern Pacific Ocean, with many of the pieces burning up due to the heat of reentry. [Space.com]
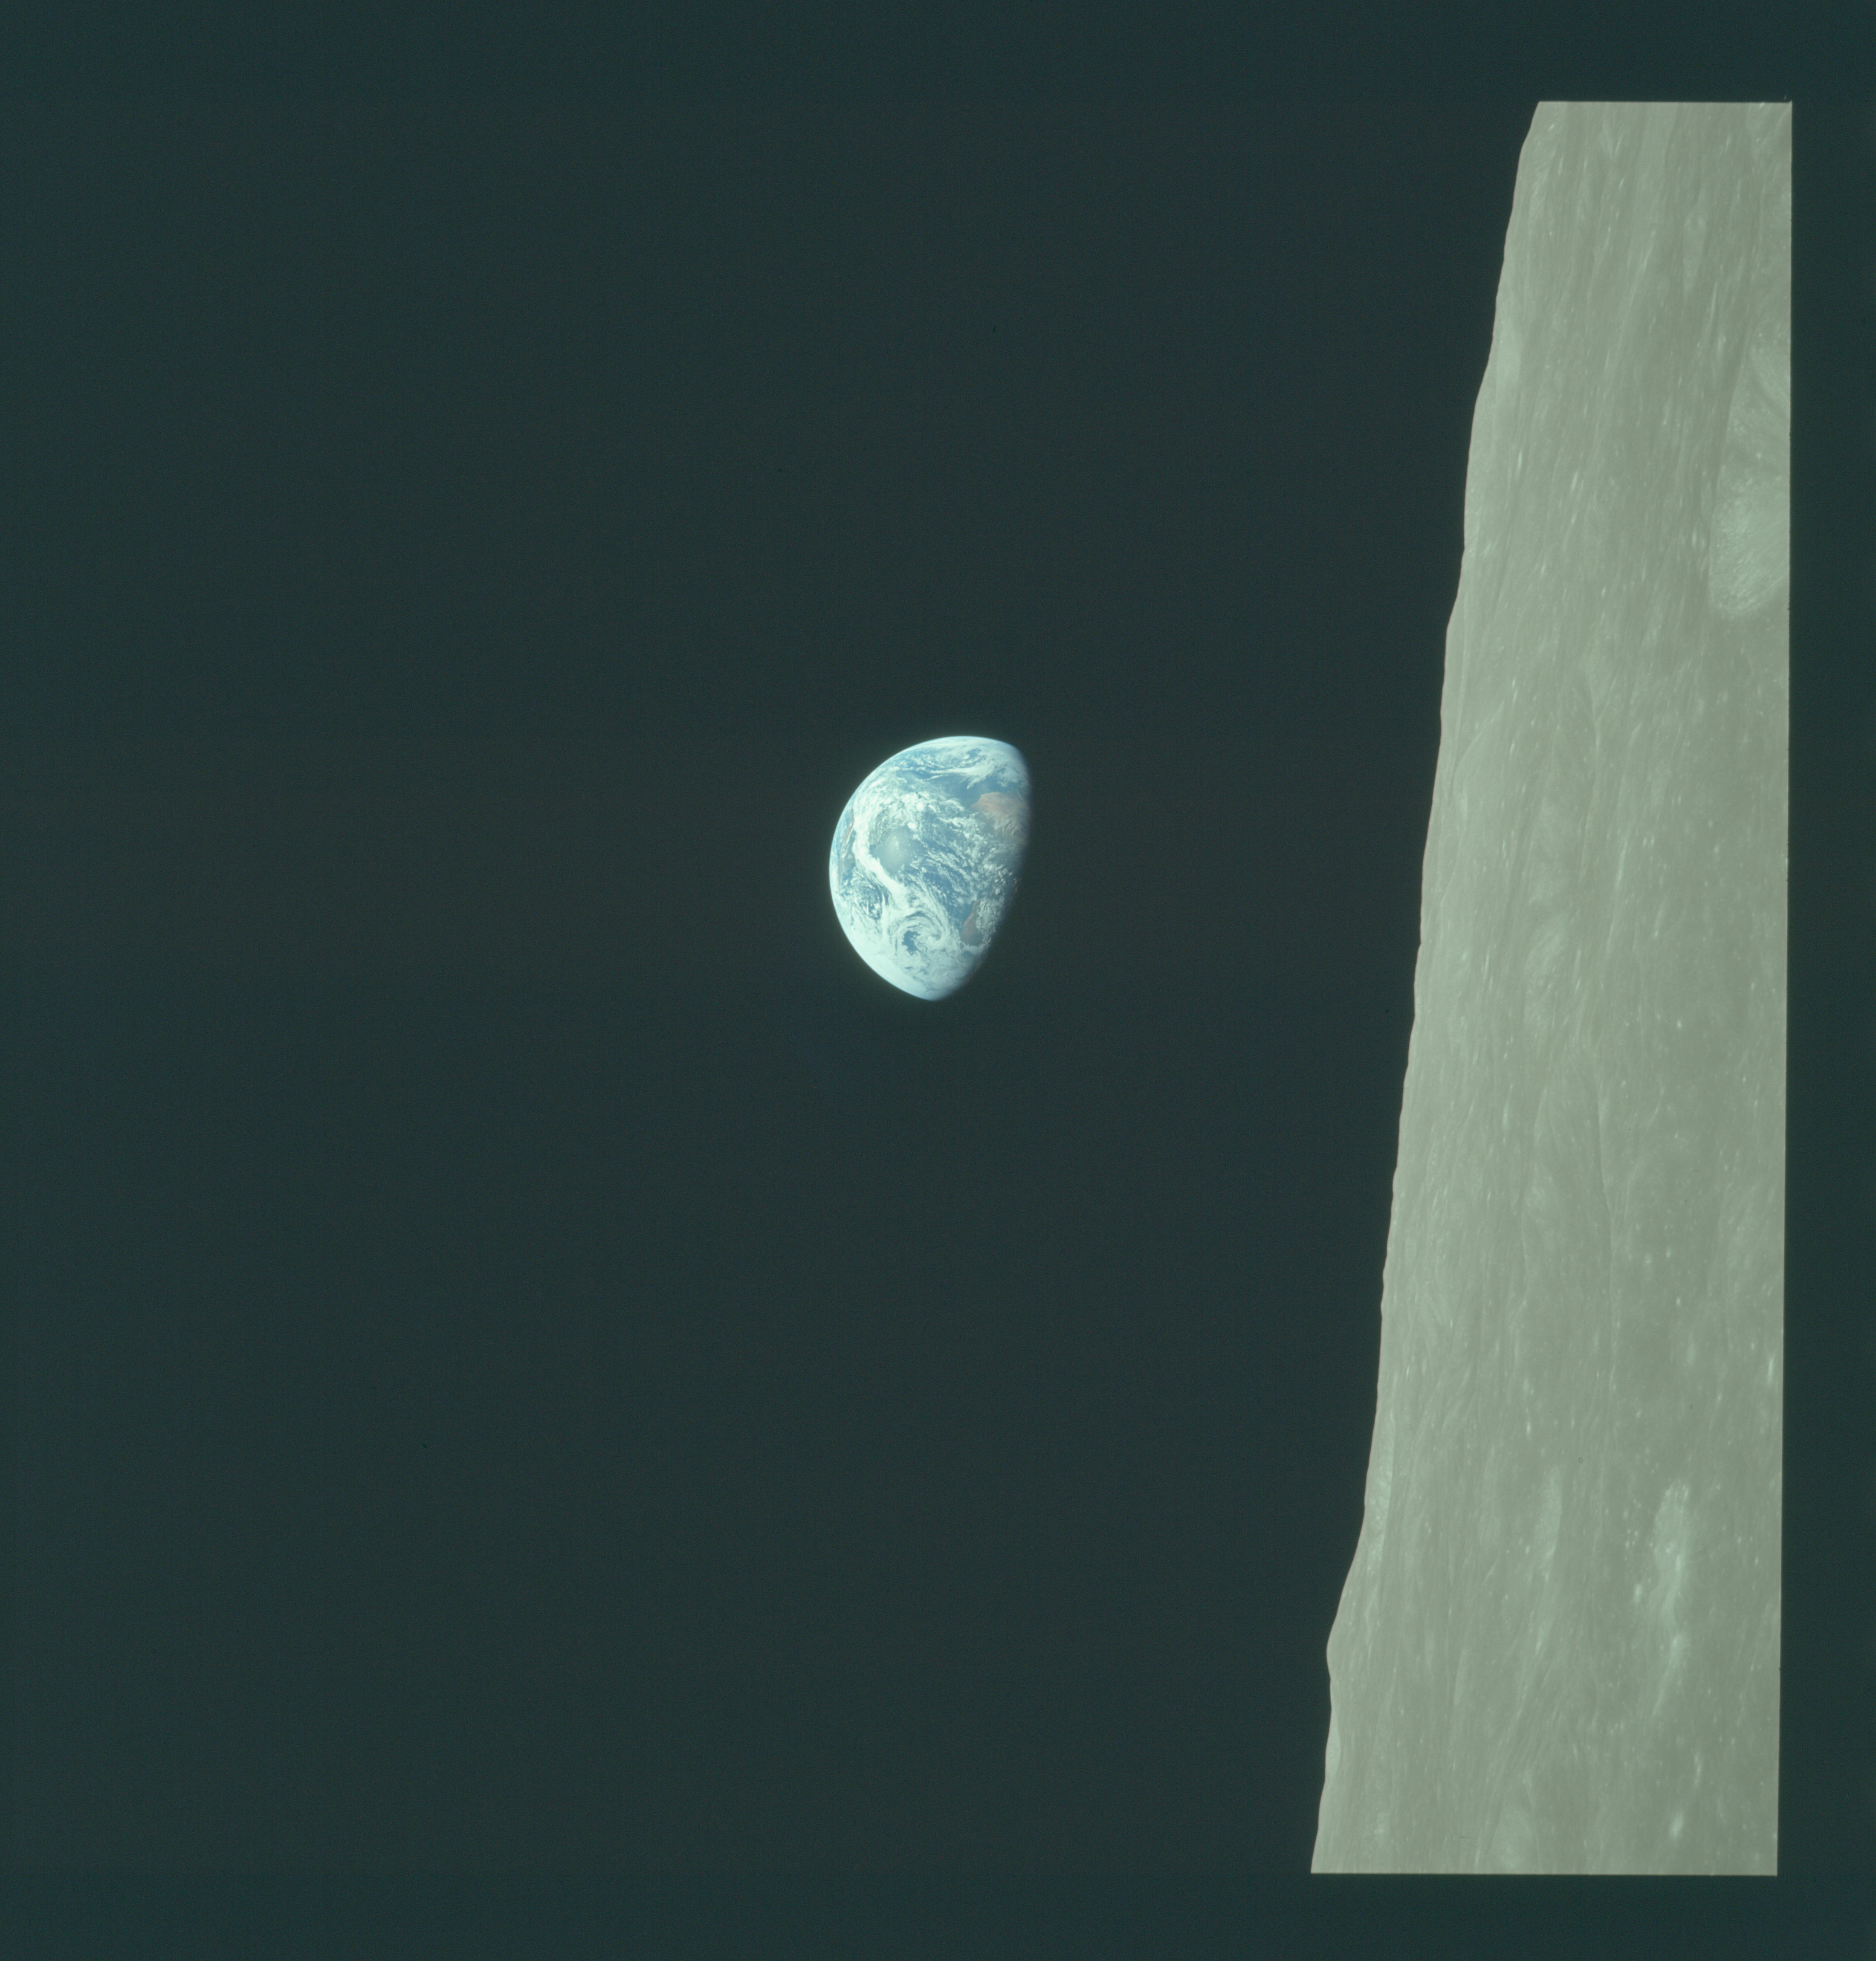
- Recent astronauts' view of Moon over Earth's limb compared with famous "Earthrise" photo -- Astronauts onboard the International Space Station took a digital photograph of a near full moon in June 2016 that was seen above the Earth as the astronauts were orbiting over Asia. Attention is directed to the Earth's limb (or the "edge" of the planet's atmosphere), featuring a gradation of colors from light to darker blue, which is the result of sunlight being scattered in the atmosphere. (The light blue indicates multiple scattering of the sunlight in a relatively dense lower atmosphere, while the dark blue results from less backscatter from a rarified upper atmosphere.) White blotches in the foreground are clouds that scatter and reflect sunlight; some snow atop some of the distant mountains could also contribute to the white color. Blue colors are reflected light from the water surfaces on lakes and rivers.
This photograph is reminiscent of the historic color NASA photograph entitled "Earthrise" taken nearly 50 years ago by an Apollo 8 astronaut on 24 December 1968 during the first manned orbit of the Moon. This view shows a barren and cratered lunar surface in the foreground, with the multi-color planet Earth seen to be rising in the background. The photo reveals that the Moon does not have a perceptible atmosphere that would scatter (or reflect) the incident sunlight, while Earth has an atmosphere, with clouds, oceans and continents that reflect more sunlight.
[NASA Earth Observatory]
- Tsunami Awareness -- The month of April is Tsunami Awareness Month in Hawaii. Guam will be conducting its 2018 Tsunami Preparedness Week during this week (1-7 April 2018) [The TsunamiZone].
- Worldwide GLOBE at Night 2018 Campaign for April commences -- The fourth in a series of GLOBE at Night citizen-science campaigns for 2018 will commence this Friday (6 April) and continue through Sunday, 15 April. GLOBE at Night is a worldwide, hands-on science and education program designed to encourage citizen-scientists worldwide to record the brightness of their night sky by matching the appearance of a constellation with the seven magnitude/star charts of progressively fainter stars. These constellations are Leo in the Northern Hemisphere and Crux for the Southern Hemisphere. Activity guides are also available. The GLOBE at night program is intended to raise public awareness of the impact of light pollution. The fifth series in the 2018 campaign is scheduled for 5-14 May 2018. [GLOBE at Night]
- Asteroids, climate change and mass extinctions -- You are invited to read this week's Supplemental
Information...In Greater Depth that describes how
geoscientists have gathered evidence of five major mass extinctions
over the last 550 million years from fossil records. These records also
help in reconstructing past climates and help in the understanding of
climate change.
Ocean in the News:
- Eye on the tropics -- Tropical cyclones were reported across the South Indian Ocean and western sections of both the South Pacific and North Pacific Oceans during the last week:
- In the eastern South Indian Ocean basin Tropical Cyclone Marcus weakened as it traveled toward the south off the western coast of Australia early last week before dissipating well off the coast. Cyclone Marcus had intensified to become a powerful category 5 tropical cyclone on the Saffir-Simpson Scale late in the previous week, as maximum sustained surface winds reached an estimated 160 mph. The NASA Hurricane Page has additional information and satellite imagery for Cyclone Marcus.
- In the western South Pacific, Tropical Storm Iris traveled toward the south over the Coral Sea, passing to the west of New Caledonia early last week. By midweek, Iris had weakened to become a tropical depression before dissipating. Satellite imagery and additional information for Tropical Storm Iris are available from the NASA Hurricane Page. [Note: Iris was a category 1 tropical cyclone on the Australian scale, which is equivalent to a weak tropical storm on the U.S. scale.]
Over this past weekend, Tropical Storm Josie formed approximately 170 miles to the west of Suva, the capital city of Fiji. Travel was initially to the east-southeast and then southeast. As of early Monday (local time), Josie was located approximately 120 miles to the south-southwest of Suva. Tropical Storm Josie was forecast to continue its travels toward the southeast out over the open waters of the South Pacific well away from any land masses. Little additional intensification was anticipated.
- In the western North Pacific, Tropical Depression Jelawat continued its track toward the west-northwest and northwest near the Caroline Islands at the start of last week. However, Jelawat intensified to become a tropical storm by midweek after it turned to the north. Turning toward the east-northeast late last week, Tropical Jelawat became a typhoon on Friday (local time) and then a super typhoon that had a category 4 status on the Saffir-Simpson Scale as maximum sustained surface winds were estimated to have reached approximately 150 mph. Heading toward the east-northeast across the open waters of the North Pacific over this past weekend, Jelawat began to weaken, becoming a tropical storm early Sunday. As of late Sunday (local time), Jelwat was interacting with a midlatitude front to become a subtropical cyclone as its center was located approximately 120 miles to the north of Pagan, a volcanic island in the Mariana Islands archipelago. Remnants of Jelawat were expected to travel toward the east-northeast during the first two days of this week. Additional information and satellite images are available on the
NASA Hurricane Page for former Super Typhoon Jelawat.
- A "Down Under" perspective of ENSO conditions -- Meteorologists with the Australian Government Bureau of Meteorology issued their most recent ENSO (El Niño-Southern Oscillation) Wrap-Up early last week in which they declared the El Niño-Southern Oscillation (ENSO) had become neutral, with neither El Niño nor La Niña conditions currently evident according to various oceanic and atmospheric indicators. Furthermore, most of the international prediction models that the forecasters surveyed indicated little sign of El Niño or La Niña developing in the upcoming months. Therefore, the forecasters declared their ENSO Outlook to be INACTIVE. [Australian Government Bureau of Meteorology] (Editor's Note: Earlier in March, forecasters with NOAA's Climate Prediction Center had maintained their La Niña Advisory, but they did indicate that a transition to ENSO neutral conditions was likely (55 percent chance) in the next several months, which would suggest a termination of their advisory by early April. EJH)
- Arctic sea ice maximum winter extent could be second smallest on record -- Scientists from NOAA and the National Snow and Ice Data Center recently reported that the annual maximum Arctic sea ice extent for this winter season, which was tentatively reached on 17 March 2018, appears to be the second smallest in the 39-year satellite record. The maximum winter Arctic sea ice extent for this winter season is second only to the record smallest maximum set one year ago during the 2016-17 season, which occurred on 7 March 2017. [NOAA Climate.gov News]
- Tool is available to graph snow or ice extent -- NOAA's National Centers for Environmental Information has made an online graphing tool available that permits the user to produce bar graphs showing monthly extent of sea ice in the Northern or Southern Hemisphere, or for the entire globe running from 1979 through early 2018. The sea ice extent data used for these graphs are from the National Snow and Ice Data Center (NSIDC). Graphs of monthly snow cover extent also can be generated for North America, Greenland, Eurasia and the Northern Hemisphere beginning in 1967 and running through present from data provided by the Rutgers University Global Snow Laboratory (GSL). Each graph includes the long-term average extent and the trend over the full period of record. Users can also download the sea ice and snow cover data to produce spreadsheets for further analysis. [NOAA Climate.gov Maps-Data]
- Viewing cloud streets and ice in the Barents Sea from space -- An image was produced from data collected by the MODIS sensor on NASA's Aqua satellite in mid-March showing a large expanse of cloud streets stretched across the Barents Sea off the northern coast of Russia. These cloud streets were produced from thermals of warm air rising from the open sea surface and being carried along by the winds in the lower atmosphere. In addition, sea ice was seen covering sections of the Barents Sea and the Kara Sea farther to the east. This image was made only two days prior to the date the National Snow & Ice Data Center has identified as when the sea ice reached maximum extent across the polar seas in the Northern Hemisphere. [NASA Earth Observatory]
- The 2018 IceBridge airborne ice survey begins in the Arctic -- Last Thursday, the first NASA IceBridge flight of this spring 2018 Arctic campaign was completed with a survey of sea ice north of Greenland. This year marks the tenth IceBridge Arctic spring campaign, which is designed to map the fastest-changing areas of the Greenland Ice Sheet and measure sea ice thickness across the western Arctic basin. The flights are scheduled to continue through the last week of April. [NOAA News]
- Satellite observes large algal bloom in the Gulf of Aden -- An enhanced color image generated from data collected by the MODIS sensor onboard NASA's Aqua satellite in mid-February shows large swirls of in the Gulf of Aden (between Somalia and Yemen) that were caused by a large winter phytoplankton bloom. Researchers onboard a ship traveling across the northern Arabian Sea on the same day that the satellite image was made were able to identify the species of phytoplankton. [NASA Earth Observatory]
- Path laid out for methane research on the federal level -- The National Academies of Sciences recently released a report entitled "Improving Characterization of Anthropogenic Methane Emissions in the United States" that calls on several federal agencies to collaborate in an effort to improve techniques for measuring methane, one of the most important greenhouse gases that are generated by human activity. This new study, which was conducted by a committee of scientists, was made at the request of NOAA, NASA, the U.S. Environmental Protection Agency and the U.S. Department of Energy to identify recommendations for improving scientists' understanding of methane emissions, their sources and how to measure them. [NOAA Office of Oceanic & Atmospheric Research News]
- Visualizing the globe if all the ice melted -- A collection of maps was produced by the National Geographic Society that provides a visualization of what the coastlines for each of the continents would like if a 216-foot rise in sea level occurred, which is assumed to be the result of melting all the land ice on Earth. Teaching tips on this topic are available for educators ranging from middle school through college level. [NOAA Climate.gov Teaching Resources]
- Impact of ocean acidification could outweigh fishing management efforts -- An international team of scientists recently reported on their research that indicates marine ecosystems typically experience negative impacts from ocean acidification that tend to counteract any benefits of marine conservation efforts. However, incorporating marine protected areas created both positive and negative impacts, while changing fishing pressure had smaller effects than either ocean acidification or marine protected areas. The research was based upon the Atlantis Ecosystem Model developed by Australia's Commonwealth Scientific and Industrial Research Organisation (CSIRO) that considers all parts of marine ecosystems: biophysical, economic and social. [NOAA National Centers for Coastal Ocean Science News]
- An All-Hazards Monitor -- This Web portal provides the user information from NOAA's National Weather Service, FAA and FEMA on
current environmental events that may pose as hazards such as tropical
weather, fire weather, marine weather, severe weather, drought and
floods. [NOAA/NWS Daily Briefing]
- Earthweek -- Diary of the Planet [earthweek.com]
Concept of the Week: Controlling Nutrient
Input into Chesapeake Bay
Chesapeake Bay is the nation's largest estuary; it is more
than 300 km (185 mi) long, 65 km (40 mi) at its broadest, and averages
about 20 m (66 ft) deep. The estuary was formed by the post-glacial
rise in sea level that flooded the valley of the ancient Susquehanna
River. The Bay receives about half its water from the Atlantic Ocean
and the other half from the more than 150 rivers and streams draining a
166,000 square kilometer land area encompassing parts of New York,
Pennsylvania, West Virginia, Delaware, Maryland, Virginia, and the
District of Columbia. Major rivers that empty into Chesapeake Bay
include the Potomac, Susquehanna, York, and James.
As described in more detail in your DataStreme
Ocean textbook, an estuary is a complex and highly
productive ecosystem where seawater and freshwater runoff meet and mix
to some degree. In Chesapeake Bay, more-dense seawater creeps northward
along the bottom of the estuary, moving under the less-dense fresh
water flowing in the opposite direction. This circulation combined with
wind-driven and tidal water motions causes salinity to decrease
upstream in the Bay, from values typical of the open ocean at its mouth
to freshwater values at its northern margin.
As in all ecosystems, organisms living in estuaries depend on
one another and their physical environment for food energy and habitat.
Phytoplankton and submerged aquatic vegetation (e.g., marsh grass) are
the primary producers (autotrophs) in estuarine food chains. Chesapeake
Bay consumers (heterotrophs) include zooplankton, finfish, shellfish,
birds, and humans.
Human activity has greatly modified Chesapeake Bay with
consequences for the functioning of the ecosystem. Much of the original
forests that covered its drainage basin were cleared and converted to
farmland, roads, cities, and suburban developments. These modifications
accelerated the influx of nutrients (i.e., compounds of phosphorus and
nitrogen), sediment, pesticides, and other pollutants into the Bay.
More nutrients spur growth of algal populations and when these
organisms die (in mid-summer), their remains sink to the bottom.
Decomposition of their remains reduces dissolved oxygen levels in the
Chesapeake's bottom water. More sediment increases the turbidity of the
water, reducing sunlight penetration for photosynthesis. Presently
Chesapeake Bay is on the Federal list of "impaired waters" and in need
of pollution abatement and remediation. States in the drainage basin
have agreed to work together to clean up the Bay but there are
significant obstacles including cost.
One casualty of human modification of the Chesapeake Bay
ecosystem was marsh grass-reduced by 90% from historical levels. Marsh
grass anchors sediment and dampens wave action thereby controlling
shoreline erosion and turbidity. Marsh grass is a food source for many
organisms including waterfowl and small mammals and serves as a primary
nursery for crabs and many species of fish. Reduction of this habitat
along with over-fishing has been implicated in the decline of
populations of blue crabs, a mainstay of the Bay fishery for more than
a century. Over the past decade, the number of adult female blue crabs
plunged by 80%. Without adequate protection by marsh grass, blue crabs
are more vulnerable to predation by striped bass (i.e., rockfish).
Striped bass turned to blue crabs as a food source when fishing reduced
the numbers of menhaden, their preferred food. Menhaden is a marine
fish in the herring family and the Bay's top fishery by weight.
Human modification of the Chesapeake Bay drainage basin
converted it from an essentially closed system to
an open system. In the original climax forests,
nutrients primarily cycled within the system with relatively little
input to the Bay. Modification of the land for agriculture increased
the area of the soil exposed to the elements and runoff from rain and
snowmelt accelerated nutrient input into the Bay. In addition to such
non-point (area) sources of nutrients are point sources including the
effluent of wastewater treatment plants that discharge treated water
into rivers and streams that drain into the Bay.
For decades, agriculture has successfully employed various
cultivation practices that limit the runoff from cropland (e.g.,
contour plowing, strip cropping, and retention ponds.) However, less
than one-third of the 300-wastewater treatment facilities located in
the Chesapeake Bay drainage basin have the technology to remove high
levels of nutrients from their effluent. Under current environmental
regulations, states are not required to regulate the nutrient content
of this discharge. But in late October 2003, the Chesapeake Bay
Foundation, a private, not-for-profit environmental advocacy
organization called on Virginia, Maryland, Pennsylvania, and the
District of Columbia to specify nutrient limits on permits they grant
to all wastewater treatment facilities. In support of their
recommendations, the Chesapeake Bay Foundation cited the many water
quality problems stemming from excessive nutrient load in the Bay
waters (e.g., algal blooms, spread of "dead zones.") According to the
U. S. EPA, under the federal Clean Water Act, a state can control
nitrogen pollution if it determines that environmental harm is taking
place. However, the EPA estimates that as much as $4.4 billion would be
required to install state-of-the-art nutrient removal technologies at
all major plants (those treating more than 500,000 gallons of
wastewater per day).
Historical Events:
- 2 April 1513...Spanish explorer Juan Ponce de Leon came
ashore on the Florida coast near present-day St. Augustine and claimed
the territory for the Spanish crown. He is reported to be the first
known European to set foot in Florida. (The History Channel)
- 2 April 1958...One of the most destructive coastal storms
in years battered New England (31 March-3 April). Some beaches between
Portland, ME and Cape Cod, MA were eroded by approximately 50 ft. Miles
of sea walls and bulkheads were either breached or demolished. Many
beachfront cottages in Massachusetts, New Hampshire and Maine were
sandblasted. (Accord's Weather Guide Calendar)
- 2 April 1926...Baden-Baden, a rotor ship
invented by Anton Flettner left Hamburg, Germany on a transatlantic
crossing, arriving in New York on 29 May 1926. The ship used two 9-ft
diameter, 50-ft high cylinders, mounted vertically on the deck at the
bow and the stern for propulsion, utilizing the aerodynamic power of
the Magnus Effect, which builds air pressure behind a rotating
cylinder. (Today in Science History)
- 3 April 1797...Captain Thomas Truxtun, USN, devised and
issued the first known American signal book using numerary system,
encompassing 10 numeral pennants, made of combinations of red, white,
blue, and yellow bunting, with flags for repeaters. This signal book
contained approximately 300 signals. Fog signals were made by gunfire.
Night signals were made by lanterns and gunfire. (Naval Historical
Center)
- 4 April 1581...The famous English navigator, Francis Drake,
completed his circumnavigation of the world (1577 to 1580) and was
knighted by Queen Elizabeth I. (Wikipedia).
- 6 April 1894...President Grover Cleveland authorized
enforcement of the Paris Award concerning the preservation of fur seals
in Alaska. (USCG Historian's Office)
- 6 April 1909...The American explorer, Commander Robert E.
Peary, USN, along with assistant Matthew Henson, and four Eskimos
reported reaching the geographic North Pole; however, navigational
errors may have meant that they were a few miles away from the exact
pole. (Naval Historical Center) (The History Channel)
- 6 April 1913...USRC Seneca, a derelict
destroyer (whose mission was to locate and destroy abandoned wrecks
that were still afloat and a menace to navigation), inaugurated the
Revenue Cutter Service's participation in the International Ice Patrol.
(USCG Historian's Office)
- 8-10 April 1958...A global 48-hr precipitation record was
established at Aurere, La Reunion Island, when 97.1 in. of rain from a
tropical cyclone fell on the Indian Ocean island. (The Weather Doctor)
- 8-14 April 1984...Intense Tropical Cyclone Kaimsy crossed
and re-crossed the northern portion of Madagascar. Winds exceeding 112
mph destroyed 80 percent of Antseranana and Mahajanga. Rainfall from
this system totaled 27.99 in. Eighty-two people were killed and 100,000
were made homeless. Damage was greater than 150 million US dollars.
(Accord's Weather Guide Calendar) (The Weather Doctor)
- 8 April 1993...What was probably a waterspout from off the Gulf of Mexico struck land near the middle of Grand Isle, LA killing 3 and injuring 39 people. (National Weather Service files)
Return to RealTime Ocean Portal
Prepared by DS Ocean Central Staff and Edward J. Hopkins,
Ph.D.,
email hopkins@aos.wisc.edu
© Copyright, 2018, The American Meteorological Society.