BACKGROUND
The question that comes to mind is how is the temperature of the state, nation or globe determined. We are aware that during the last 100 years, several thousand stations around the country have been taking temperature and precipitation observations. This period represents a relatively short time interval in Earth's history.
The "instrumental period of record" that is used to consider national or global temperatures depends upon the number of observing stations that would form a network that climatologists feel could adequately provide representative readings of the temperature of a large area. For the US, this period of record is usually considered by the NCEI scientists to have started in 1895, when a sufficient number of cooperative stations were established to complement the US Weather Bureau stations. However, many climatologists maintain that the period of record for global temperatures can be extended back to 1880 or even 1850.
To determine the state, national or global average temperatures requires some area-weighting scheme that uses the station data.
STATE, REGIONAL AND NATIONAL RECORDS
Determination of statewide monthly and annual temperatures and precipitation commenced in the 1895 as the monthly data for all observing stations across each state were averaged numerically. This procedure, which does not represent a true area-weighted average, was continued for slightly more than half a century. In 1951, the national center that eventual became NCEI instituted a set of 344 climate divisions across the nation. These divisions, which generally correspond to the crop reporting districts developed by the US Department of Agriculture, are usually assumed to represent relatively uniform climatic conditions. In many instances especially across the central section of the nation, the boundaries of the division are determined by the county lines; see map. Depending upon state size or variations in climate, the number of divisions per state ranges from one (Delaware and Rhode Island) to ten (such as Texas, Idaho and Pennsylvania). Divisional average temperature and precipitation are computed for each division within the state, using data collected from those stations within the division that report both temperature and precipitation. Since cooperative observers often make their observations of maximum/minimum temperature and 24-hour precipitation in the morning, an adjustment is now made to correct the time of observation for these cooperative stations to conform with the calendar day used by those stations operated by the National Weather Service or the Federal Aviation Administration. Statewide monthly average temperatures and precipitation since 1951 are based upon the divisional average statistics weighted by area of the division in the respective state.
Beginning in March 2014, NCEI has changed its spatial averaging technique to an improved one based upon algorithms (computer programs) that account for spatial coverage and various observing methods where the data from the irregularly distributed station locations are used to generate a uniformly spaced gridded data set with 5-km by 5-km grids. These gridded data running from 1895 to present form maximum/minimum/average temperature and precipitation data sets for each climate division and for each state (identified as the nClimDiv dataset). Additional statistics for the divisions for the period 120 years include Palmer Drought Severity Index values, along with heating and cooling degree-day units. Statewide time series charts for ten climate variables, along with the data, can be obtained. Computed regional average temperatures and precipitation are also generated for nine climate regions. Monthly national average temperature and precipitation values are also computed in similar fashion. In 2015 NCEI added a time-series of divisional and statewide average temperatures and precipitation for Alaska that commences in 1925.
GLOBAL RECORDS
NCEI also generates monthly temperatures for the Earth based upon temperature data collected from several thousand worldwide observing stations on land and ocean. The Global Historical Climatology Network is used for land and sea-surface temperature anomalies (or arithmetic differences between observed and long-term average temperatures). Spatial averaging algorithms generate uniformly spaced gridded data set for the temperature anomalies with 5-degree (latitude) by 5-degree (longitude) grids. A time-series of the annual temperature anomalies have been computed for the globe (combined land and ocean) commencing in 1880. Separate monthly and annual temperature anomalies for land and ocean are computed in addition to a combined mean for the entire globe. These temperature anomalies are calculated with respect to the 20th century (1901-2000). By using a temperature anomaly time-series, knowledge of the actual mean temperature of the Earth was not needed, as many areas of the world remain relatively inaccessible.
NASA's Goddard Institute for Space Studies (GISS) produces its own surface temperature analysis for use in climate modeling. A Global Land-Ocean Temperature Index is computed as a time series of temperature anomalies based upon the 1951-1980 averaging interval. Click on the "Global Annual Mean Surface Air Temperature Change" label to display the time series for the index running from 1880 to the present. (Note: The dotted black line is the annual mean, the solid red line is the five-year running mean and the green bars show uncertainty estimates.) Although the observed temperature data essentially are the same as used by NCEI, differences in the area weighting averaging schemes cause slight differences between the time series produced by GISS and NCEI.
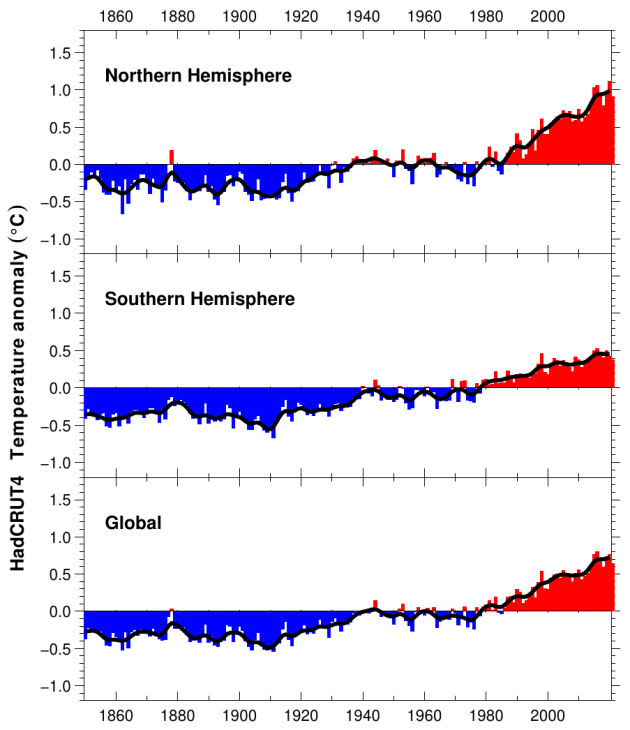
A third time series of global and hemispheric temperature anomalies that incorporate land and marine data has been developed in the United Kingdom by the Climatic Research Unit at the University of East Anglia and the Hadley Centre for Climate Prediction and Research in the Meteorological Office. This time series is relative to the 1961-90 reference period means and extends back to 1850.
Currently, long term global precipitation time series are unavailable as precipitation observations were rarely taken aboard ships.
Return to ECS RealTime Climate Portal
Prepared by Edward J. Hopkins, Ph.D., email hopkins@aos.wisc.edu
© Copyright, 2018, The American Meteorological Society.