WEEKLY CLIMATE NEWS
2-6 April 2018
ITEMS OF
INTEREST
- Chinese space station reenters Earth's atmosphere -- Tiangong-1, China's school-bus sized space station that had been in orbit around the Earth since November 2011, finally reentered the atmosphere on Sunday evening (0016Z on 2 April, or 8:16 PM EDT on the first). According to the U.S. Strategic Command's Joint Force Space Component Command, Tiangong-1 broke apart as it traveled into the atmosphere over the southern Pacific Ocean, with many of the pieces burning up due to the heat of reentry. [Space.com]
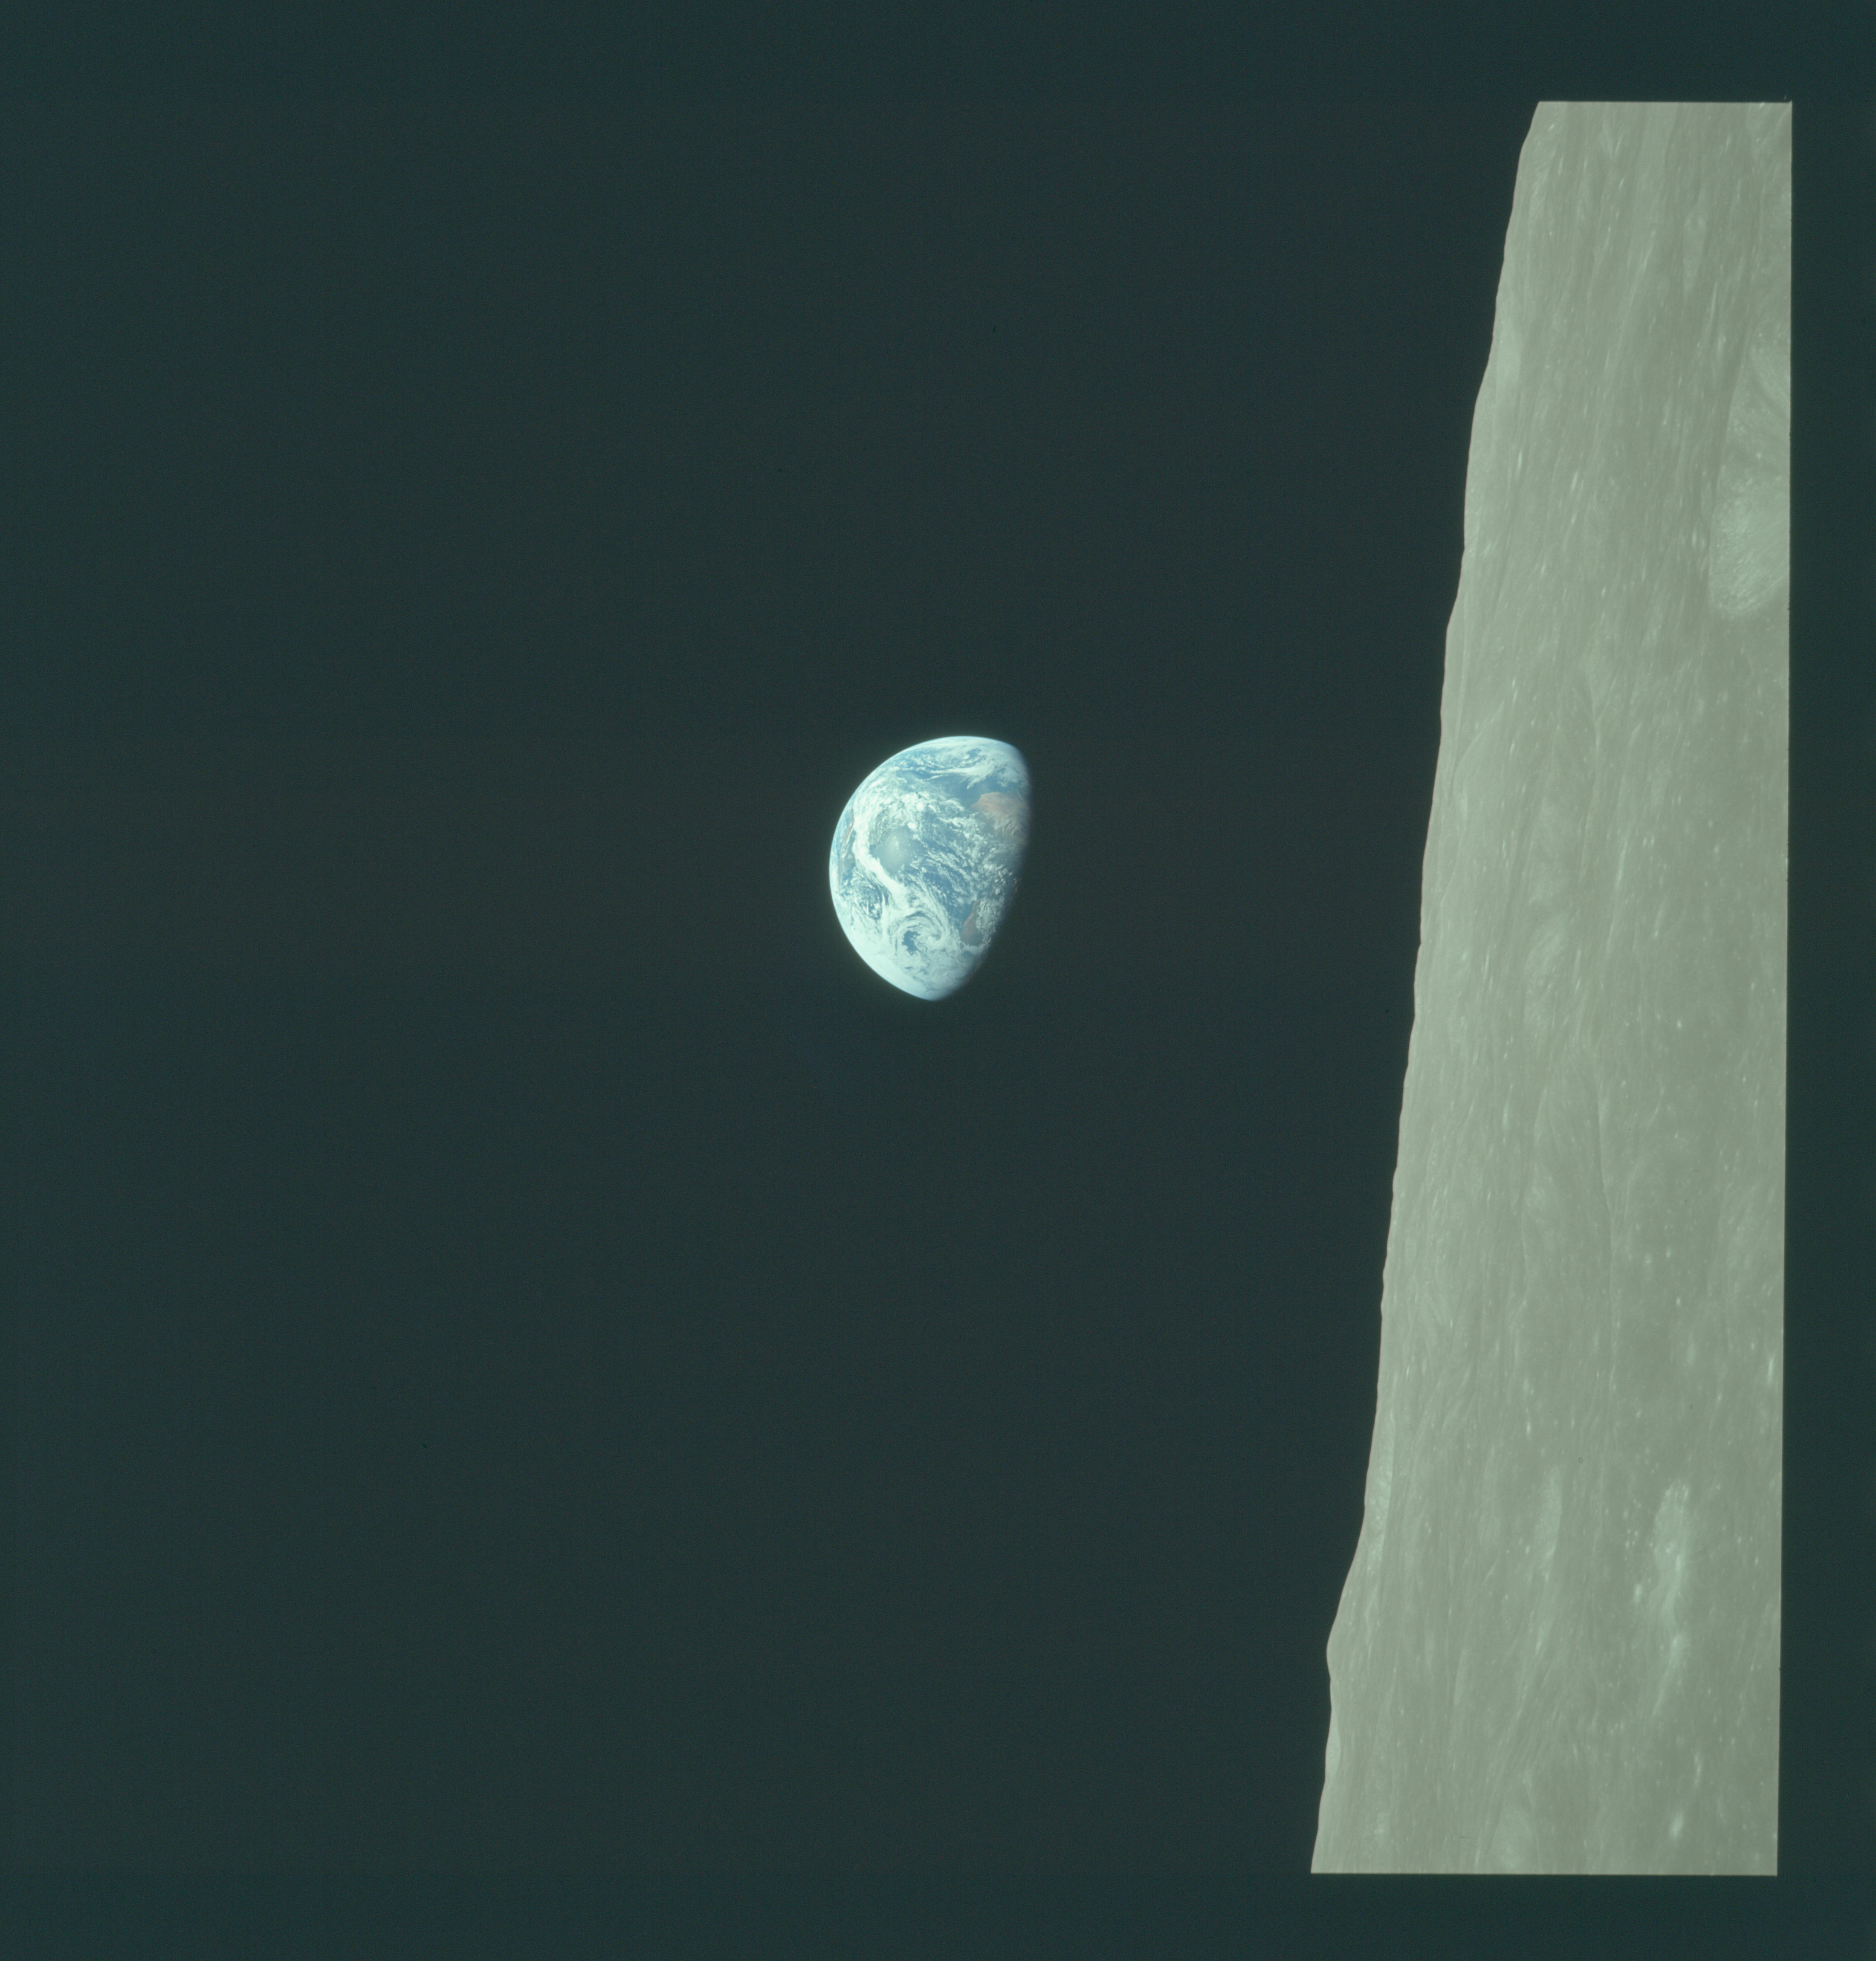
- Recent astronauts' view of Moon over Earth's limb compared with famous "Earthrise" photo -- Astronauts onboard the International Space Station took a digital photograph of a near full moon in June 2016 that was seen above the Earth as the astronauts were orbiting over Asia. Attention is directed to the Earth's limb (or the "edge" of the planet's atmosphere), featuring a gradation of colors from light to darker blue, which is the result of sunlight being scattered in the atmosphere. (The light blue indicates multiple scattering of the sunlight in a relatively dense lower atmosphere, while the dark blue results from less backscatter from a rarified upper atmosphere.) White blotches in the foreground are clouds that scatter and reflect sunlight; some snow atop some of the distant mountains could also contribute to the white color. Blue colors are reflected light from the water surfaces on lakes and rivers.
This photograph is reminiscent of the historic color NASA photograph entitled "Earthrise" taken nearly 50 years ago by an Apollo 8 astronaut on 24 December 1968 during the first manned orbit of the Moon. This view shows a barren and cratered lunar surface in the foreground, with the multi-color planet Earth seen to be rising in the background. The photo reveals that the Moon does not have a perceptible atmosphere that would scatter (or reflect) the incident sunlight, while Earth has an atmosphere, with clouds, oceans and continents that reflect more sunlight.
[NASA Earth Observatory]
- Worldwide GLOBE at Night 2018 Campaign for April commences -- The fourth in a series of GLOBE at Night citizen-science campaigns for 2018 will commence this Friday (6 April) and continue through Sunday, 15 April. GLOBE at Night is a worldwide, hands-on science and education program designed to encourage citizen-scientists worldwide to record the brightness of their night sky by matching the appearance of a constellation with the seven magnitude/star charts of progressively fainter stars. These constellations are Leo in the Northern Hemisphere and Crux for the Southern Hemisphere. Activity guides are also available. The GLOBE at night program is intended to raise public awareness of the impact of light pollution. The fifth series in the 2018 campaign is scheduled for 5-14 May 2018. [GLOBE at Night]
- High-quality maps of April temperature and precipitation normals across US available -- The PRISM Climate Group at Oregon State University's website has prepared high-resolution maps depicting the normal maximum, minimum and precipitation totals for April and other months across the 48 coterminous United States for the current 1981-2010 climate normals interval. These maps, with a 800-meter resolution, were produced using the PRISM (Parameter-elevation Regressions on Independent Slopes Model) climate mapping system.
- April weather calendar for a city near you -- The Midwestern Regional Climate Center maintains an interactive website that permits the public to produce a ready to print weather calendar for any given month of the year, such as April, at any of approximately 270 weather stations around the nation. (These stations are NOAA's ThreadEx stations.) The entries for each day of the month includes: Normal maximum temperature, normal minimum temperature, normal daily heating and cooling degree days, normal daily precipitation, record maximum temperature, record minimum temperature, and record daily precipitation; the current normals for 1981-2010.
- Tsunami Awareness -- The month of April is Tsunami Awareness Month in Hawaii. Guam will be conducting its 2018 Tsunami Preparedness Week during this week (1-7 April 2018) [The TsunamiZone].
- Masters climatology -- The 2018
Masters Golf Tournament, the 82nd edition of one of professional golf's four major
championships, will be held this coming week (Thursday, 5 April through Sunday, 8 April) at the
Augusta National Golf Club in Augusta, GA. The Southeast Regional
Climate Center has produced a Masters
Climatology for 1934-2017 that includes the daily maximum and
minimum temperatures and the 24-hour precipitation totals for each day
of the four-day event in early April, extending over the last 81 Masters.
- Reconstructing past climates -- Scientists
from many disciplines have developed a variety of methods that use
proxy indicators such as tree rings, ice cores and ocean cores to
reconstruct past climates, some extending back thousands of years. For
more details on paleoclimatology, or the study of past climates, and
available data sets, please read this week's Supplemental
Information...In Greater Depth.
CURRENT
CLIMATE MONITORING
- Arctic sea ice maximum winter extent could be second smallest on record -- Scientists from NOAA and the National Snow and Ice Data Center recently reported that the annual maximum Arctic sea ice extent for this winter season, which was tentatively reached on 17 March 2018, appears to be the second smallest in the 39-year satellite record. The maximum winter Arctic sea ice extent for this winter season is second only to the record smallest maximum set one year ago during the 2016-17 season, which occurred on 7 March 2017. [NOAA Climate.gov News]
- Viewing cloud streets and ice in the Barents Sea from space -- An image was produced from data collected by the MODIS sensor on NASA's Aqua satellite in mid-March showing a large expanse of cloud streets stretched across the Barents Sea off the northern coast of Russia. These cloud streets were produced from thermals of warm air rising from the open sea surface and being carried along by the winds in the lower atmosphere. In addition, sea ice was seen covering sections of the Barents Sea and the Kara Sea farther to the east. This image was made only two days prior to the date the National Snow & Ice Data Center has identified as when the sea ice reached maximum extent across the polar seas in the Northern Hemisphere. [NASA Earth Observatory]
- Tool is available to graph snow or ice extent -- NOAA's National Centers for Environmental Information has made an online graphing tool available that permits the user to produce bar graphs showing monthly extent of sea ice in the Northern or Southern Hemisphere, or for the entire globe running from 1979 through early 2018. The sea ice extent data used for these graphs are from the National Snow and Ice Data Center (NSIDC). Graphs of monthly snow cover extent also can be generated for North America, Greenland, Eurasia and the Northern Hemisphere beginning in 1967 and running through present from data provided by the Rutgers University Global Snow Laboratory (GSL). Each graph includes the long-term average extent and the trend over the full period of record. Users can also download the sea ice and snow cover data to produce spreadsheets for further analysis. [NOAA Climate.gov Maps-Data]
- New airborne instrument can take simultaneous measurements of two atmospheric greenhouse gases -- Scientists have been making test flights aboard an instrumented research King Air B200 aircraft from NASA's Langley Research Center to measure the atmospheric concentrations of carbon dioxide and water vapor, two powerful greenhouse gases. A first-of-its-kind triple-pulse Integrated Path Differential Absorption lidar is the instrument located in the belly of the aircraft that is making the nearly simultaneous measurements of the two gases. [NASA Langley Research Center Feature]
- Path laid out for methane research on the federal level -- The National Academies of Sciences recently released a report entitled "Improving Characterization of Anthropogenic Methane Emissions in the United States" that calls on several federal agencies to collaborate in an effort to improve techniques for measuring methane, one of the most important greenhouse gases that are generated by human activity. This new study, which was conducted by a committee of scientists, was made at the request of NOAA, NASA, the U.S. Environmental Protection Agency and the U.S. Department of Energy to identify recommendations for improving scientists' understanding of methane emissions, their sources and how to measure them. [NOAA Office of Oceanic & Atmospheric Research News]
- Diverging trends in surface water abundance across the U.S. are studied -- Researchers from the University of Oklahoma and colleagues recently reported on their examination of trends in surface water abundance across the 48 contiguous United States between 1984 and 2016. They found that ten water-poor states in the West were experiencing a decline in the areal size of open surface water bodies, while twenty water-rich states in the Southeast and the northern Plains were seeing an upward trend in the size of surface water area. The team analyzed approximately 370,000 Landsat images and generated annual surface water body frequency maps for 33-year time span at 30-meter spatial resolution. Relationships between water body area and land water storage were also examined. The surface water area data were combined with the land water storage data from NASA's Gravity Recovery and Climate Experiment (GRACE) during 2002 to 2016 to investigate the data dynamics in severe drought and pluvial years. Climate was determined to be the primary driving factor for these diverse trends in year-long surface water area since 1984. Assessing these trends in surface water resources at high spatial resolution is critical for public water supply, industry, agriculture, biodiversity and ecosystem services. [University of Oklahoma Public Affairs]
- The 2018 IceBridge airborne ice survey begins in the Arctic -- Last Thursday, the first NASA IceBridge flight of this spring 2018 Arctic campaign was completed with a survey of sea ice north of Greenland. This year marks the tenth IceBridge Arctic spring campaign, which is designed to map the fastest-changing areas of the Greenland Ice Sheet and measure sea ice thickness across the western Arctic basin. The flights are scheduled to continue through the last week of April. [NOAA News]
CLIMATE
FORCING
- Dance of a melting snowflake is visualized -- A scientist at NASA's Jet Propulsion Laboratory has developed a three-dimensional numerical model of melting snowflakes in the atmosphere that is intended to provide a better understanding of how snow melts and that can help scientists recognize the signature in radar signals of heavy, wet snow. This 3-D visualization model may have applications in climate modeling. [NASA Feature]
- Snow cover has an orange tint from space -- A natural color image was generated from data collected by the MODIS sensor on NASA's Aqua satellite early last week that showed orange-colored snow that covered sections of eastern Europe that included Bulgaria, Romania, Moldova, Ukraine, and Russia. The orange color was due to large quantities of dust from the Sahara Desert that were carried by strong winds from northern Africa across the Mediterranean and into eastern Europe, where the dust was deposited on the snow. The Ozone Mapping & Profiler Suite (OMPS) on the NASA/NOAA Suomi NPP satellite detected high levels of airborne aerosols over the region. [NASA Earth Observatory] (Editor's note:EJH)
CLIMATE
FORECASTS
- Updated regional climate impacts and outlooks released -- During the last week NOAA scientists and their colleagues in other partner agencies released a set of "Quarterly Climate Impacts and Outlook" reports for March 2018. These reports, which cover ten regions of the nation (along with adjoining sections of Canada), outline historical climate trends and describe major climate events that occurred during the previous three months that constitute meteorological winter (December 2017 through February 2018). They also provide future climate
outlooks for the next three months (April-June 2018) that spans the remainder of meteorological spring and the first month of summer for each of ten regions around the nation. [NOAA NCEI News] https://www.ncei.noaa.gov/news/march-2018-regional-climate-impacts-and-outlooks
- A "Down Under" perspective of ENSO conditions --
Meteorologists with the Australian Government Bureau of Meteorology issued their most recent ENSO (El Niño-Southern Oscillation) Wrap-Up early last week in which they declared the El Niño-Southern Oscillation (ENSO) had become neutral, with neither El Niño nor La Niña conditions currently evident according to various oceanic and atmospheric indicators. Furthermore, most of the international prediction models that the forecasters surveyed indicated little sign of El Niño or La Niña developing in the upcoming months. Therefore, the forecasters declared their ENSO Outlook to be INACTIVE. [Australian Government Bureau of Meteorology] (Editor's Note: Earlier in March, forecasters with NOAA's Climate Prediction Center had maintained their La Niña Advisory, but they did indicate that a transition to ENSO neutral conditions was likely (55 percent chance) in the next several months, which would suggest a termination of their advisory by early April. EJH)
- Canadian national seasonal outlook issued -- Forecasters with Environment Canada issued their outlooks for temperature and precipitation across Canada for the three months of April through June 2018, which represents the last two months of meteorological spring and the start of meteorological summer. The temperature outlook indicates that below normal temperatures (1981-2010) temperatures for these three months could be expected from the Rockies in southern British Columbia eastward across the Prairie Provinces to southwestern Ontario. On the other hand, sections of western and northern Canada could have above average spring and early summer temperatures, extending from the Yukon Territory northeastward across the Canadian Archipelago. The remaining areas of Canada should experience near normal spring temperatures.
The Canadian precipitation outlook for April through June 2018 indicates that near normal precipitation should prevail across most sections of Canada. However, widely scattered areas of above average precipitation could occur over the next three months especially in several of the Maritime Provinces, extending from Nova Scotia and New Brunswick northeastward into Newfoundland, and across Arctic Canada. A few small areas of central Canada Arctic could have below normal precipitation for the months running from April through June.
[Note for comparisons and continuity with the three-month seasonal outlooks of temperature and precipitation generated for the continental United States and Alaska by NOAA's Climate Prediction Center, one would need to use Environment Canada's probabilistic forecasts for temperature and precipitation.] - Efforts needed to close the gap between weather and climate predictions -- Three weather and climate experts from NOAA's Modeling, Analysis, Predictions and Projections (MAPP) Program, the World Meteorological Organization (WMO) and the World Climate Research Programme (WCRP) recently provided their perspective on how to address the challenges that are involved in producing skillful forecasts that bridge the gap between weather and climate, which covers the "subseasonal to seasonal" (S2S) timescale running from approximately two weeks up to a three-month season. They envision blending techniques used in weather and climate forecasting to provide "seamless" predictions across the weather-climate continuum. The international S2S Prediction Project and the NOAA MAPP Program's S2S Prediction Task Force have been formed with the goal to bring the weather and climate communities together and bridge the prediction gap. [NOAA Office of Oceanic & Atmospheric Research News]
CLIMATE
AND THE BIOSPHERE
- Impact of ocean acidification could outweigh fishing management efforts -- An international team of scientists recently reported on their research that indicates marine ecosystems typically experience negative impacts from ocean acidification that tend to counteract any benefits of marine conservation efforts. However, incorporating marine protected areas created both positive and negative impacts, while changing fishing pressure had smaller effects than either ocean acidification or marine protected areas. The research was based upon the Atlantis Ecosystem Model developed by Australia's Commonwealth Scientific and Industrial Research Organisation (CSIRO) that considers all parts of marine ecosystems: biophysical, economic and social. [NOAA National Centers for Coastal Ocean Science News]
CLIMATE
EDUCATION
- Visualizing the globe if all the ice melted -- A collection of maps was produced by the National Geographic Society that provides a visualization of what the coastlines for each of the continents would like if a 216-foot rise in sea level occurred, which is assumed to be the result of melting all the land ice on Earth. Teaching tips on this topic are available for educators ranging from middle school through college level. [NOAA Climate.gov Teaching Resources]
CLIMATE
AND SOCIETY
Concept of the Week: Extending the
Historical North American Drought Record
Through history, drought has been a major concern for many
people as the lack of adequate water can adversely affect agriculture,
and in the extreme case, the availability of potable (drinkable) water.
The Case in Point for Chapter 9 describes the migration of ancient
peoples across the semiarid Southwest due to what may have been major
drought conditions. During the last century, the "Dust Bowl" era
drought in the 1930s created many problems in this country. The effects
of this seven-year long drought were made worse by poor agricultural
techniques and land management. The effect of the drought on the nation
was also exacerbated by the coincident Great Depression. Drought
remains a problem today across Texas and the West Coast as we can see
from inspection of the current weekly US National Drought Monitor
produced by the National Drought Mitigation Center.
How do the current drought events compare with earlier
droughts? A time series of computed Palmer Drought Severity Index
(PDSI) values began in 1895 when a sufficiently dense climate network
was established. During the 20th century, several episodes of drought
have had a major national impact. The exceptional drought that
developed in the early 1930s extended across much of the nation
resulting in the "Dust Bowl" era. The PDSI time series shows that the
1930s drought was the worst in the last century, with nearly 80 percent
of the nation experiencing moderate to extreme drought in 1934. During
the 1950s, the southern Plains and the Southwest also experienced a
major drought, when 50 to 60 percent of the nation was under drought
conditions.
What about farther back in history? Sophisticated tree-ring
analysis techniques allow researchers to extend the drought record
across a large section of North America farther into the past. In 1998,
Edward R. Cook at Columbia University's Lamont-Doherty Earth
Observatory along with colleagues at Arizona and Arkansas reconstructed
past drought conditions across the nation based upon annual tree-ring
data obtained from a network of 388 climatically sensitive tree-ring
sites. From these data, time series of annual summertime (June-August)
PDSI values were determined back to 1700 at 155 grid points across the
nation. These gridded tree-ring chronologies were calibrated with PDSI
chronologies generated by instrumental records at selected Historical
Climate Network stations commencing in the late 19th century. The
researchers found that the 1930s drought was the most severe drought to
hit the nation since 1700.
By 2004, the series was expanded to 835 tree-ring sites,
primarily across the West, where exactly dated annual tree-ring
chronologies were obtained. The new grid covered most of North America
with a latitude-longitude spacing of 2.5 degrees. In addition to the
286 grid point PDSI time series, annual contour maps of PDSI were
constructed that span much of the continent. This work permitted
extension of the spatial and temporal coverage of the drought
reconstruction not only into Canada and Mexico, but back 2000 years.
From this more recent data set they produced an online "North American Drought Atlas." They found several "megadroughts" in North America were
even more severe than the 1930s drought. In addition to being more
severe, some droughts extended over several decades, considerably
longer than those of the 20th century. One such megadrought was in the
16th century, an event that along with another megadrought into the
early 17th century has been implicated by some researchers in the
hardships encountered by British settlers in the Virginia area, such as
the disappearance of the Roanoke Colony.
Historical Events:
- 2 April 1970...The last snowstorm of the 1969-70 winter
season came to an end at Chicago, IL as 10.7 inches of snow fell -- a
final contribution to the season's amount of 77 inches, which set a new
all-time snow season record for the city. (Intellicast)
- 2 April 1975...A severe storm over the northeastern US
began on this day and blasted the area for the next 3 days. Wind gusts
reached 87 mph at West Harpswell, ME and Boston, MA recorded its lowest
April pressure on record (28.68 inches). Tides along the coast ran 2 to
4 feet above normal and anywhere from 1 to 4 feet of snow fell from
western New York to northern Maine with the higher elevations receiving
the most. (Intellicast)
- 3 April 1955...Record snow fell across north-central
Wyoming and south-central Montana as Sheridan WY established a 24-hour
snowfall record with 26.7 inches. (The Weather Doctor)
- 3 April 1996...Marquette, MI recorded 12.6 inches of snow
on this day to raise its seasonal snowfall to 250.8 inches -- the
city's snowiest winter ever. The old record was 243.8 inches set back
in 1981-82. The snowfall for the month now stood at 43.4 inches -- the
snowiest April on record for the city as well. (Intellicast)
- 4 April 1933...Pigeon River Bridge, MN reported 28 inches
of snow, which established the state 24-hour snowfall record. (4th-5th)
(The Weather Channel)
- 4 April 1955...A severe 3-day spring snowstorm ended over
north central Wyoming and south central Montana. Sheridan, WY had near
blizzard conditions for 43 hours and recorded 22.7 inches of snow in 24
hours on the 3rd to set a new 24-hour snowfall
record. Billings, MT had a storm total of 42.3 inches, a new single
storm snowfall record. (Intellicast)
- 4 April 1973...Sandia Crest, NM reported a snow depth of 95
inches, a record for the state of New Mexico. (The Weather Channel)
- 5 April 1815...The Tambora Volcano in Java erupted on this date. Ash from the eruption would circle the globe, blocking sunlight and leading to the unusually cold summer in 1816. On 6 June 1816, snow would fall as far south of Connecticut with some places in New England picking up 10 inches. On the 4th of July, the temperature at Savannah GA plunged to 46 degrees. Eastern North America and Europe had freezing nighttime temperatures in August. (National Weather Service files)
- 5 April 1926...A reported 0.65 inches of rain fell in one
minute at Opid's Camp, CA (Intellicast)
- 5 April 1945 ...The temperature at Eagles Nest, NM plunged
to 36 degrees below zero to establish an April record for the
continental United States. (Sandra and TI Richard Sanders - 1987)
- 5 April 1989...Unseasonably hot weather prevailed in the
southwestern U.S. Afternoon highs of 100 degrees at Santa Maria, CA and
105 degrees in Downtown Los Angeles established records for the month
of April. (The National Weather Summary)
- 6 April 1886...Detroit, MI recorded its biggest snowfall in
24 hours when 25.4 inches fell. (Intellicast)
- 6 April 1989...Unseasonably hot weather prevailed in
California. Afternoon highs of 91 degrees in Downtown San Francisco, 93
degrees at San Jose, 98 degrees at San Diego, 103 degrees at Santa
Maria, 104 degrees at Riverside, and 106 degrees in Downtown Los
Angeles established records for the month of April. (The National
Weather Summary)
- 6 April 1990...The last measurable snowfall of the 1989-90
season occurred at Valdez, AK. This brought the season snowfall to a
whopping 560.2 inches, breaking the old record of 517 inches set back
in the 1928-29 season. (Intellicast)
- 7 April 1857...A late season freeze brought snow to every state in the Union. Even as far south as Houston, TX the mercury dropped to 21 degrees. (National Weather Service files)
- 8-10 April 1958...A global 48-hour precipitation record was
established at Aurere, La Reunion Island, when 97.1 in. of rain from a
tropical cyclone fell on the Indian Ocean island. (The Weather Doctor)
- 8 April 1989...Two dozen cities in the southwestern U.S.
reported new record high temperatures for the date. Phoenix, AZ equaled
their record for April of 104 degrees established just the previous
day. (The National Weather Summary)
Return to RealTime Climate Portal
Prepared by Edward J. Hopkins, Ph.D., email hopkins@aos.wisc.edu
© Copyright, 2018, The American Meteorological Society.